

The Multiple Comparisons Problem is a statistical issue that arises when numerous hypothesis tests are conducted using the same dataset, dramatically increasing the overall probability of finding at least one false positive result.
This information is crucial for data analysts and SEO professionals who are evaluating performance across many different metrics and need to accurately determine if observed signals are genuine or merely random chance.
External context
When working with your own pages, running multiple statistical tests simultaneously increases the risk of a Type I error. This means that even if there is no actual positive effect from your efforts, you might mistakenly interpret random noise as significant evidence of success. Therefore, it is essential to adjust for this increased probability when drawing conclusions from large sets of data.
Multiple comparisons problem Wikipedia contributors, “Multiple comparisons problem”, en.wikipedia.orgLicence01What is the underlying mechanism?
Every time you run an analysis or test a hypothesis, there is an inherent baseline probability of error. If your standard significance threshold (alpha) is set at 0.05, it means that for any single test, there’s a 5% chance of seeing a positive result even if nothing has actually changed—a false positive. The problem isn't the individual tests; it's multiplying those chances together. If you measure brand visibility across ten different AI search models (Model A, Model B, ... Model J), and each test has a 0.05 chance of error, your overall probability of finding at least one 'significant' result purely by luck skyrockets far above the acceptable threshold. The sheer volume of tests inflates the risk profile.
When you measure many things at once—like checking your brand's performance against 50 different AI search queries—you increase the odds that you will find some 'statistically significant' result purely by accident. It’s like flipping a coin 10 times and expecting heads on the last flip; it might just be chance.
02What concrete steps can you take this week?
Do not treat every single data point as an independent test. To control for the Multiple Comparisons Problem, focus your efforts on grouping and prioritizing. First, limit your scope: instead of tracking performance against 100 different long-tail queries, select the top five most critical query clusters that directly impact revenue. Second, use a hierarchical approach to analysis. Test major changes (like site architecture updates) first, and only then test minor variations within those successful groups. Third, when presenting findings, always report both the raw data and the adjusted significance level for your core metrics. This forces stakeholders to consider the cumulative risk of drawing too many conclusions.
check
Group related performance indicators (e.g., all 'AI Search Visibility' metrics) into single composite scores rather than analyzing them individually.
warn
Avoid running ad-hoc analyses on every piece of data that looks interesting; these are the primary culprits for inflated false positives.
03How do you notice this problem in your data?
The primary indicator is a pattern of 'significant' findings that lack clear, intuitive business causality. You might see positive statistical results across dozens of niche metrics—for example, finding minor gains in click-through rate (CTR) for queries related to 'sustainable plumbing fixtures' on Model C, and another minor gain for 'best artisanal soap' on Model E. Individually, these small wins are manageable. Collectively, however, they suggest that the entire measurement framework is picking up noise rather than a single, actionable improvement. Look for metrics showing high variance relative to their impact; if 90% of your tests yield marginal gains, it suggests the system is over-interpreting weak signals.
How the record puts it
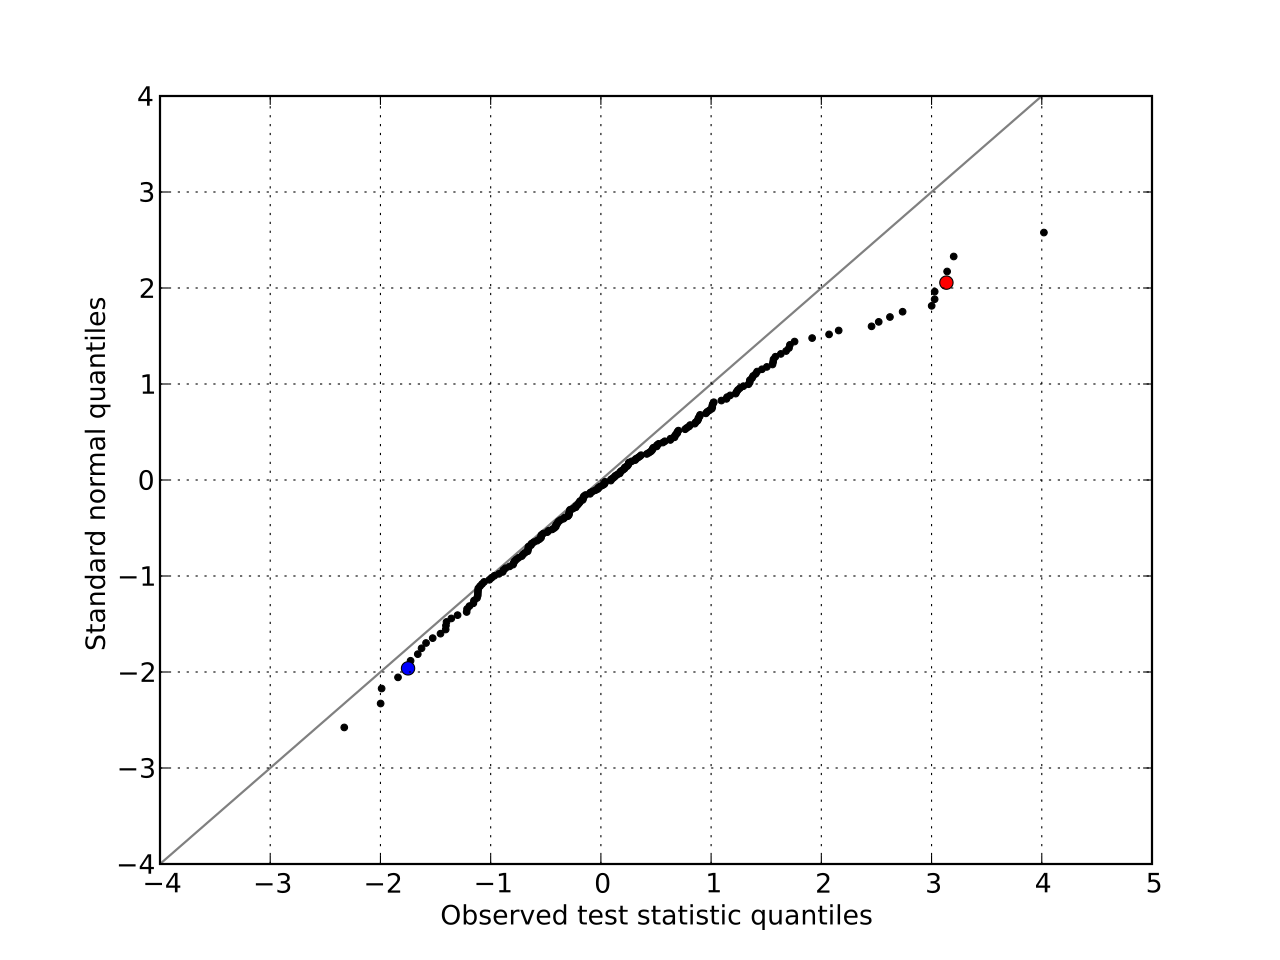
Multiple comparisons, multiplicity or multiple testing problem occurs when many statistical tests are performed on the same dataset.
04Common measurement pitfalls to avoid
Marketers often fall into the trap of 'p-hacking'—the practice of testing and retesting data until a statistically significant result appears. This is not science; it is chance. To maintain rigor, always define your hypothesis before looking at the results. If you start by finding what looks positive across 20 variables, you have already compromised the integrity of your measurement.
warn
Interpreting a single 'p-value' in isolation without considering the total number of tests run.
check
Always establish an alpha level (e.g., 0.05) and stick to it across all major reports.
05When does this problem not apply?
This concept is most relevant when you are comparing multiple, independent variables or metrics within a single dataset. It generally does not apply to controlled A/B testing where the scope is strictly limited (e.g., testing only two versions of a headline against each other). Furthermore, if your measurement tool forces you into a narrow, pre-defined set of core performance indicators (KPIs) that are mathematically linked, the risk is inherently reduced because you are not independently testing dozens of unrelated variables.
06A worked example in AI search context
Consider a brand tracking effort that monitors 15 different types of user intent (informational, transactional, navigational, etc.) across three major AI models. If the team reports finding 'significant' positive lift for five or six of those intents—say, Model A shows lift in Intent X, Model B shows lift in Intent Y, and so on—it is highly probable that these individual lifts are statistical flukes. The overall conclusion should be: 'We have not yet identified a consistent, statistically robust area of improvement across all major models,' rather than listing six separate, minor wins.
Instead of reporting 6 small, significant gains, report the overall trend and state that further data collection is needed to confirm any single positive signal.
The entry above is written by GetLoopLoop. What follows is what independent catalogues hold about the same term — none of it is the source of this page.
- Kind of thing
- type of fallacy
The same term on Wikipedia
Catalogued in 14 languages07Frequently asked questions
How is the Multiple Comparisons Problem different from simply needing a larger sample size?
It depends on whether your issue is insufficient data or too much testing capacity. A larger sample size addresses low statistical power, meaning you might miss a real effect because your test wasn't sensitive enough. The Multiple Comparisons Problem occurs when the data itself is fine, but by running too many separate tests, you artificially inflate the probability of finding a false positive result.
When should I stop testing metrics and assume that my observed 'significant' changes are due to chance?
You should be highly skeptical when multiple seemingly unrelated metrics show significance simultaneously. A good rule of thumb is to pause testing if the pattern of results feels overly perfect or lacks a clear, logical connection back to a specific SEO action. If you find 10 things that changed significantly but can't explain why, it suggests an over-reliance on statistical chance.
What are the practical steps I can take right now to reduce my risk of making false positive claims?
The most effective step is to pre-select a small, core set of metrics and define your hypotheses before looking at the data. This process forces you to treat those key variables as dependent tests rather than independent ones. You should also consider using statistical corrections, like Bonferroni correction, which mathematically adjusts your significance threshold based on the number of tests performed.
Does this problem only apply when I am comparing different types of search intent?
No, it applies whenever you are running multiple statistical analyses or testing numerous variables concurrently. While comparing distinct user intents is a common example, the principle holds true if you are measuring 20 different keywords, 5 different AI models, or 10 separate content clusters against each other in one dashboard view.
If I use specialized brand tracking software, does it automatically protect me from this issue?
No, specialized tools can only measure what you ask them to measure; they do not inherently solve the statistical problem. The tool provides the raw data, but interpreting that data requires careful methodological design. You must still manually control which metrics are tested and how those tests relate to your core business questions.
Wikimedia Commons
Related visuals with source and licence credit

08Asked out loud
The same term in the words somebody uses speaking to an assistant rather than typing into a box — written from the situation, which is why each one carries the situation it came from.
Usually, yes, you are running into the Multiple Comparisons Problem. When you test too many metrics at once, even if every single one is meaningless, the math increases your chance of finding a few false positives. It's like flipping a coin until you get heads—you might find it 'significant,' but it was just luck.
You need to explain the concept of multiple comparisons. When you look at too many variables, it’s statistically likely that some will appear positive purely by chance, which is called a false positive signal. You should recommend grouping these metrics and only testing the most critical groupings.
It sounds like you might be dealing with the Multiple Comparisons Problem. The risk is that your analysis has generated too much 'significant' data without enough underlying business causality to support it. Instead, focus on identifying three core metrics and building a narrative around those instead.