

A one-tailed test is a statistical method used when testing a hypothesis that predicts an outcome will change significantly in only one specific direction, rather than potentially moving in either direction.
Individuals studying statistical significance or hypothesis testing would consult this information alongside guides on two-tailed tests and general concepts of probability distributions.
External context
When designing a study, you must first determine if your research question predicts an outcome that will move only in one specific direction (like increasing), or if it could potentially be higher or lower than the reference point. If the expected change is directional, a one-tailed test is appropriate; otherwise, a two-tailed test should be used. Selecting the correct type of test is crucial because using the wrong method can lead to incorrectly accepting or rejecting the alternative hypothesis.
One- and two-tailed tests Wikipedia contributors, “One- and two-tailed tests”, en.wikipedia.orgLicence01What It Is and How It Works
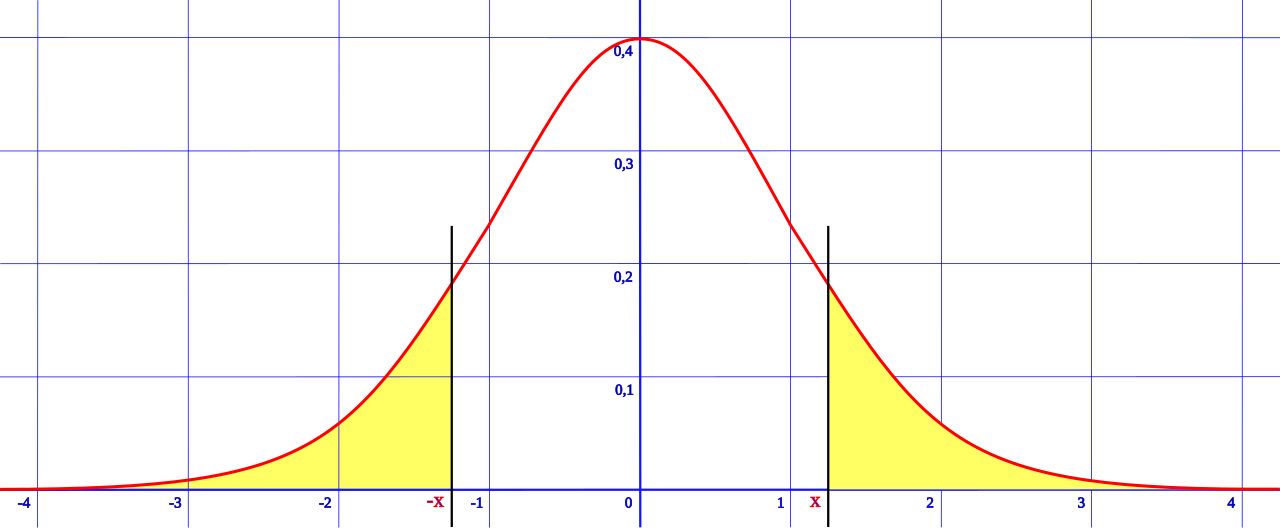
When running an experiment, you usually start with a null hypothesis—the assumption that nothing has changed. A standard two-tailed test checks if the results are different from the baseline (they could be higher or lower). However, if your team has strong prior evidence or theory suggesting that a change can only improve performance, using a One-Tailed Test is more precise. This method adjusts the statistical calculation to focus entirely on one tail of the probability distribution curve—either the positive side (greater than) or the negative side (less than). By doing this, you increase your statistical power specifically for detecting movement in that expected direction. You are essentially telling the test: 'I only care if this metric gets better; I don't need to worry about it getting worse.' This focus makes the threshold for declaring a significant result easier to meet, provided your initial directional assumption is correct.
This statistical tool helps you determine if a change—like improving brand visibility in AI search—is definitely moving up, or definitely moving down, compared to what it was before. You are not testing if it's different; you are betting that it will only go one way.
02What To Do About It This Week
Before setting up any A/B test or analyzing performance data related to AI search visibility, explicitly define your expected direction of change. If you are testing a new content format designed specifically to boost brand mentions in generative answers, your hypothesis should state: 'The new format will cause the average mention count to increase by X%.' This clear directional prediction is what justifies using this test type. Documenting this assumption is crucial for reproducibility and stakeholder buy-in. Furthermore, ensure that the metrics you are tracking (e.g., click-through rate from AI snippets, branded search volume) are directly correlated with your expected positive outcome. If the metric could plausibly decrease due to external factors, reconsider if a One-Tailed Test is appropriate.
03How It Is Measured or Noticed
When reviewing the output of a statistical test, you are looking at the p-value relative to your directional assumption. In a One-Tailed Test, if the calculated p-value is below your chosen significance level (alpha), and the observed data falls in the predicted direction, you can reject the null hypothesis with more confidence than you could using a two-tailed test. Practically speaking, this means that when comparing your experimental group to the control group, the metric of interest must show a statistically significant difference only on the side you predicted. You will look for evidence that the mean or median has crossed a specific threshold in one direction, confirming the directional shift.
How the record puts it
In statistical significance testing, a one-tailed test and a two-tailed test are alternative ways of computing the statistical significance of a parameter inferred from a data set, in terms of a test statistic.
04Common Mistakes to Avoid
Misapplying this test can lead to incorrect conclusions about your brand's performance. Always verify the underlying assumptions before proceeding.
05When It Does Not Apply or What It Is Confused With
The primary limitation is that the test's validity rests entirely on the accuracy of your initial directional assumption. If the true effect is actually in the opposite direction, this test will fail to detect it, leading to a false sense of security regarding your brand strategy. This concept is often confused with simply analyzing trends. While observing a consistent upward trend is helpful for intuition, a One-Tailed Test provides mathematical proof that the observed change is unlikely due to random chance alone. If you are merely describing what happened (e.g., 'Our visibility increased last quarter'), you do not need this test; you only need it when you are making a formal claim about causality and direction.
06A Worked Example
Imagine your goal is to improve brand visibility in AI search results. You hypothesize that adding structured data markup (Schema) will increase the percentage of times your brand name appears directly within a generative answer box compared to your current baseline rate. Therefore, you set up a One-Tailed Test. Your null hypothesis is: 'The new Schema implementation has no effect on mention frequency.' Your alternative hypothesis is: 'The new Schema implementation will cause the mean mention frequency to be greater than the baseline.' You are only testing for an increase.
If the test yields a p-value of 0.01 and your alpha level is 0.05, you reject the null hypothesis and conclude that the Schema markup significantly increased brand mentions.
The entry above is written by GetLoopLoop. What follows is what independent catalogues hold about the same term — none of it is the source of this page.
- Also called
- two-sided, one-tailed test
The same term on Wikipedia
Catalogued in 8 languages07Frequently asked questions
How does a One-Tailed Test differ fundamentally from a Two-Tailed Test?
A One-Tailed Test only checks for evidence of change in one specific direction, such as whether brand visibility has increased. Conversely, a Two-Tailed Test examines if there is any significant difference—either an increase or a decrease—from the baseline. Using the wrong type can lead to missing subtle but important changes that fall outside your initial directional assumption.
When should I use this test instead of simply observing raw performance data trends?
You should use a One-Tailed Test when you have a strong, theoretically grounded prediction about the direction of change. If you are merely looking for any change and don't know if it will be positive or negative, simple observation might suffice. The test provides statistical rigor to confirm that your expected directional shift is unlikely due to random chance.
What specific metrics should I focus on when reviewing the output of a One-Tailed Test?
When analyzing the results, pay close attention to the calculated p-value and how it relates to your directional null hypothesis. You must confirm that the observed difference moves significantly in the direction you predicted. If the test fails to reject the null hypothesis on that specific side of the distribution, then no statistically significant change was detected.
If my initial directional assumption proves incorrect, does the statistical result become invalid?
Yes, the validity of the conclusion rests entirely on the accuracy of your initial hypothesis. If the true effect moves in a direction opposite to what you tested for, the test cannot detect it and will yield misleading results. In such cases, you must switch to a Two-Tailed Test or re-evaluate your core assumption.
What is the primary statistical risk of using this test if I claim significance when none exists?
The main risk is incorrectly concluding that a directional improvement has occurred when, in reality, the change was due to random chance. This increases your Type I error rate (false positive) because you are narrowing your scope and making it easier to reject the null hypothesis prematurely.
How long must we wait or how many data points do we need before running a reliable One-Tailed Test?
The required duration depends on the expected magnitude of the effect and the variability of your brand search data. Generally, you need enough data to achieve sufficient statistical power for the specific test you are running. Running it with insufficient data will result in low power and an inability to detect a real change even if one exists.
Wikimedia Commons
Related visuals with source and licence credit

08Asked out loud
The same term in the words somebody uses speaking to an assistant rather than typing into a box — written from the situation, which is why each one carries the situation it came from.
Usually, you need a statistical test like one-tailed analysis to confirm if that observed change is truly significant. It helps determine if the movement in brand visibility falls far enough outside the expected range that random chance can't explain it. This moves you beyond just looking at the numbers.
It depends on whether your initial directional assumption is strongly supported by historical data and expert knowledge. If you are confident that the change must be positive, a one-tailed test gives you the statistical basis to make that high-stakes bet. However, always remember the limitation regarding unexpected shifts.
You might be confusing correlation with causation, which is a common mistake. Using directional testing helps structure your thinking by forcing you to define what 'improvement' means before looking at the p-value. It provides a framework to determine if the minor fluctuations are statistically relevant to your specific goal.