

Regression to the Mean is a statistical phenomenon stating that if an observed measurement of a random variable is unusually high or low, subsequent measurements are likely to be closer to the variable's average value.
This concept is particularly useful for marketers and data analysts who read about interpreting volatile search performance metrics or analyzing natural fluctuations in key statistics.
External context
When reviewing your own page data, remember that identifying an extremely high or low outlier result does not guarantee a permanent shift in performance. Statistically, the next set of measurements are expected to naturally trend back toward the overall average, meaning volatility is often temporary.
Regression toward the mean Wikipedia contributors, “Regression toward the mean”, en.wikipedia.orgLicence01What it is and how it works
The concept hinges on recognizing that extreme data points are often influenced by chance factors, not just underlying changes in brand authority or content quality. When a metric—like organic impressions or click-through rate (CTR)—experiences an outlier spike, this peak performance is usually due to a confluence of temporary variables: perhaps a single viral mention, a minor algorithm fluctuation, or favorable seasonal timing. These temporary boosts inflate the data point far beyond your true mean. The statistical principle dictates that when these random factors dissipate, the metric will naturally 'recede' toward its historical average range, regardless of any permanent changes you made to your SEO strategy.
If your brand suddenly sees record-high visibility because of one unique event, don't assume that level will last forever. Regression to the Mean suggests that performance naturally tends to drift back toward what is normal for you, even if the cause was temporary luck or an outlier event.
02What to do about it
Do not panic when performance falls after a major spike. Instead of overreacting or making drastic changes based on the dip, focus on building sustainable foundations. This week, audit your content for structural weaknesses that allowed the temporary boost. For example, if you saw high traffic due to one specific keyword cluster, ensure you have created comprehensive topic clusters around related subjects. Concrete actions include: 1) Diversifying link acquisition sources so you aren't reliant on a single type of promotion. 2) Improving technical SEO elements (like schema markup or site speed) that provide consistent, reliable performance improvements regardless of external luck. 3) Establishing clear baseline metrics for 'normal' operation to avoid mistaking natural correction for failure.
03How it is measured or noticed
You notice regression when you observe a sharp, non-linear deviation from your established historical trend line. Look at performance graphs and identify points that sit significantly outside the standard deviation of your typical range. If your average monthly impressions are 100k, but one month hits 250k due to an unexpected industry event, subsequent months naturally trending back toward 100k is expected behavior. To quantify this, plot performance metrics (like keyword ranking volatility or organic traffic) over a long period and visually identify the 'band' of typical performance. Any point falling far outside that band warrants caution; it signals potential statistical noise rather than a permanent shift in market demand or search engine favorability.
How the record puts it
In statistics, regression toward the mean is the phenomenon where if one sample of a random variable is extreme, the next sampling of the same random variable is likely to be closer to its mean.
04Common mistakes to avoid
- warn: Assuming that peak performance was due to a permanent structural change (e.g., 'We are now permanently more authoritative'). This ignores the role of random chance.
- warn: Over-investing resources into maintaining an artificially high level of visibility achieved by temporary means, leading to wasted budget when the natural curve dips.
- warn: Comparing single months' performance directly without accounting for seasonal cycles or macro-economic trends. Always compare apples to apples (e.g., Q1 this year vs. Q1 last year).
05When it does not apply or what it is confused with
Regression to the Mean is a statistical tool, not a universal law. It fails when the underlying cause of the extreme performance was due to a permanent change in market dynamics, search engine updates, or your core content strategy. For example, if Google fundamentally changes how it ranks image results, and your brand's visibility drops across the board, that is not regression; it is a systemic shift requiring strategic adaptation. It is often confused with autocorrelation—the idea that past performance always dictates future performance. While history informs us, extreme outliers require skepticism about their longevity.
06A worked example
Consider a brand whose product suddenly goes viral due to a major news outlet featuring it prominently (a massive, temporary boost). The ensuing month shows excellent traffic, but the following month sees a noticeable drop back toward its usual level. This decline is likely regression. The initial spike was driven by the external event (the news coverage), not necessarily an improvement in the brand's intrinsic search quality or content depth. A marketer should recognize that while the viral exposure was valuable for awareness, they must now focus on creating evergreen assets that sustain traffic once the novelty wears off.
"The initial spike in impressions was highly correlated with a single industry award announcement. The subsequent dip back to 15% above baseline suggests natural correction rather than a loss of SEO momentum."
The entry above is written by GetLoopLoop. What follows is what independent catalogues hold about the same term — none of it is the source of this page.
- Also called
- regression to the mean, reversion to the mean, reversion to mediocrity, mean regression
- Kind of thing
- phenomenon, empirical statistical law
The same term on Wikipedia
Catalogued in 22 languages07Frequently asked questions
How is Regression to the Mean different from natural market seasonality or a genuine shift in brand authority?
It depends on the source of the extreme data point. Seasonality represents predictable, cyclical patterns tied to time (like holiday spikes), while regression relates to randomness and chance following an outlier spike. A true shift in brand authority means the underlying quality or relevance has permanently changed, which is a deeper indicator than merely moving back toward a historical average.
If our performance is consistently high, does that mean we are immune to regression, or must we still account for it?
You cannot assume immunity from statistical tendencies. Even sustained above-average performance can be influenced by temporary factors like a single successful PR mention or favorable search algorithm tweaks. It is always best practice to model historical variability and consider the probability that current high numbers are due to chance.
What is the most damaging mistake I could make if I wrongly attribute performance fluctuations to regression?
The biggest mistake is prematurely cutting investment or changing strategy based on a temporary dip. If you assume a drop is purely statistical noise, you might abandon a profitable channel that was actually showing genuine long-term growth. This leads to reactionary spending and missed opportunities.
How far into the future should I wait after an extreme spike before assuming the data has stabilized?
There is no fixed waiting period, but generally, you should observe at least three to five measurement cycles following the outlier event. This allows enough time for random chance factors—which drive regression—to play out naturally. Analyzing a single subsequent month after a massive spike is usually insufficient.
What specific statistical tests or modeling approaches help predict if an observed deviation is due to regression versus genuine change?
Advanced time-series analysis, such as ARIMA or Prophet models, can incorporate historical volatility and seasonal components to distinguish between the two. These tools model expected variability around a trend line, helping you determine if your current performance falls within the statistically expected range or represents a true structural break.
Wikimedia Commons
Related visuals with source and licence credit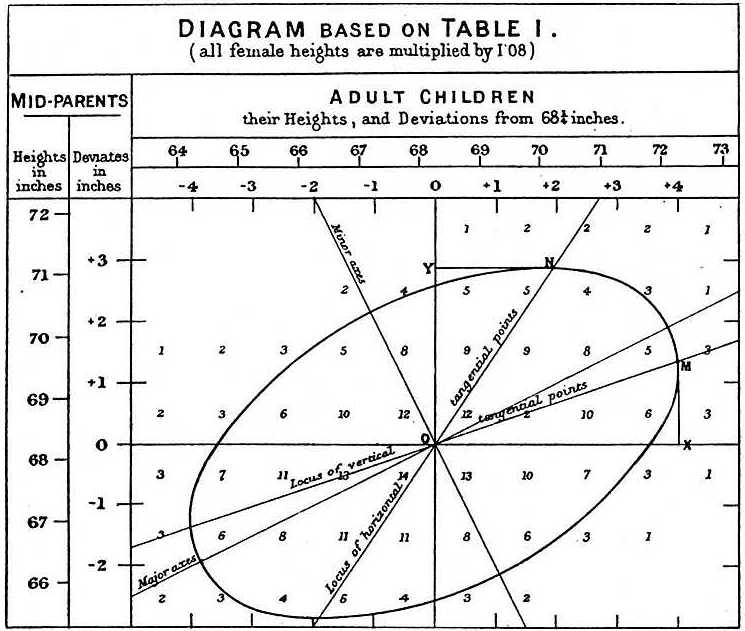


08Asked out loud
The same term in the words somebody uses speaking to an assistant rather than typing into a box — written from the situation, which is why each one carries the situation it came from.
Yes, it is often statistically expected that performance will drop back toward its average after a massive outlier spike. This tendency to revert is called regression to the mean. It doesn't necessarily mean your brand authority declined; it usually means the initial boost was due to chance factors.
No, you shouldn't immediately panic just because of a sharp drop. The dip might simply be the statistical tendency for performance to revert toward its typical range following an extraordinary event. It’s crucial to look at the underlying trend line over a longer period rather than focusing solely on the immediate deviation.
You should observe the performance for several measurement cycles following the spike before drawing firm conclusions. Since random factors often drive extreme spikes, waiting allows chance elements—which cause regression—to play out and reveal the true underlying trend.