

The T-Test is a statistical hypothesis test used to determine if the difference observed between the means of two populations is statistically significant.
Individuals studying statistics or performing data analysis often consult this guide when comparing results from two distinct groups.
External context
This test is essential for determining if two groups are significantly different in their responses, especially when certain parameters must be estimated using the available data. It utilizes a Student's t-distribution, which is particularly relevant when scaling terms within the test statistic cannot be known beforehand. While its results often closely resemble those of a Z-test, the t-test is specifically used because it accounts for situations where the dataset size may be smaller.
Student's t-test Wikipedia contributors, “Student's t-test”, en.wikipedia.orgLicence01what it is and how it works
The T-Test calculates a t‑value by comparing the difference between the two group means to the variability within each group. First, it finds the average of each sample and the overall spread. Then it divides the mean difference by a pooled standard deviation, producing a t‑value. The larger the t‑value, the stronger the evidence that the groups are not the same. It assumes the data are roughly normally distributed and that the groups have similar variances.
A T-Test tells you if the average of one group is different from another group.
02what to do about it
To run a T-Test, first collect two comparable sets of numbers, such as conversion rates before and after a landing page change. Use a spreadsheet tool or statistical software that has a T-Test function. Check that each group has at least 30 observations to satisfy the sample size rule. Verify that the variances are similar; if not, consider a Welch’s T-Test variant. Record the resulting p‑value and compare it to your significance threshold, typically 0.05.
03how it is measured or noticed
The T-Test result appears as a p‑value, which indicates the probability that the observed difference occurred by chance. A p‑value below 0.05 is usually taken as statistically significant, meaning the groups likely differ. In practice, you notice the test when a platform reports a significance score next to a metric comparison, or when a dashboard highlights a change with a confidence flag. The t‑value itself is less commonly shown, but the p‑value is the key indicator.
How the record puts it
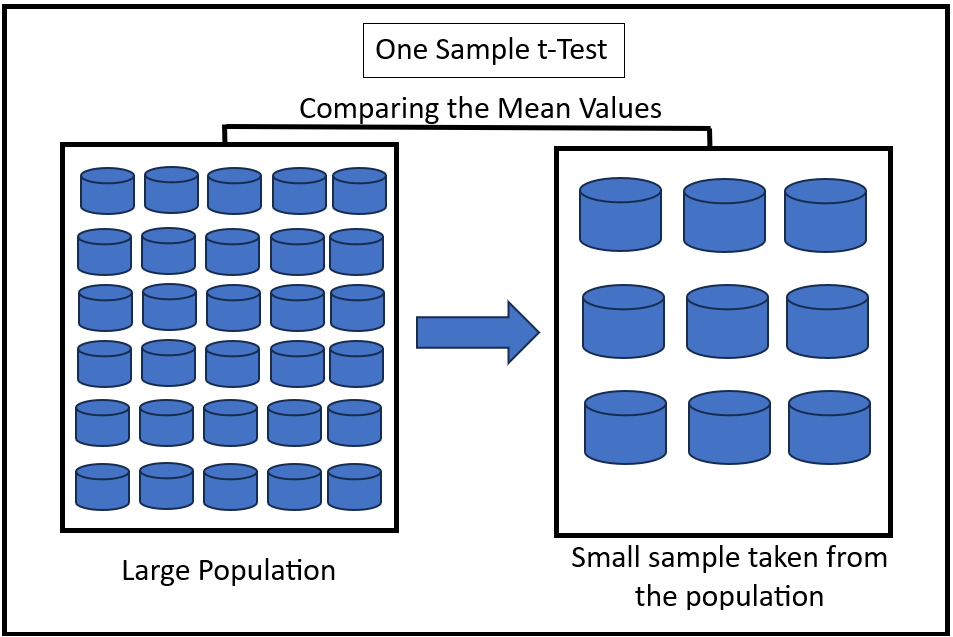
Student's t-test is a statistical test used to test whether the difference between the response of two groups is statistically significant or not.
04common mistakes
Common mistakes to avoid:
- Using the test on data that isn't roughly normal or has unequal variances.
- Ignoring the sample size requirement and running the test on tiny groups.
- Treating a non-significant p-value as proof that the groups are the same.
05limits
The T-Test is not suitable for comparing more than two groups; for multiple comparisons use ANOVA or a non-parametric alternative. It also assumes independent observations, so it should not be applied to time-series data where points are correlated. Additionally, it can be confused with a simple difference test that looks only at raw numbers without considering variability.
06a worked example
Imagine a marketer runs two ad variations and records daily click counts: version A averages 120 clicks with a standard deviation of 15, version B averages 100 clicks with a standard deviation of 12. Running a T-Test yields a t-value of 3.2 and a p-value of 0.001. Since the p-value is below 0.05, the marketer concludes the difference is statistically significant and may keep the better-performing version. Example: 120 vs 100 clicks gives p = 0.001.
The test shows a p-value of 0.001, indicating a real difference.
The entry above is written by GetLoopLoop. What follows is what independent catalogues hold about the same term — none of it is the source of this page.
- Also called
- t-test, t test, Student t-test
- Named after
- William Sealy Gosset
- Kind of thing
- statistical test
The same term on Wikipedia
Catalogued in 40 languages07Frequently asked questions
How is a T-Test different from a Z-Test?
A T-Test is used when sample sizes are small or population variance is unknown, while a Z-Test requires known population variance and larger samples.
When should I use a T-Test instead of ANOVA?
Use a T-Test for comparing exactly two groups. For three or more groups, ANOVA is appropriate to avoid multiple comparisons.
What if my T-Test shows no significant difference but I expect one?
A non-significant result might occur if sample sizes are too small, variability is high, or the actual effect is too subtle to detect with current data.
Wikimedia Commons
Related visuals with source and licence credit

08Asked out loud
The same term in the words somebody uses speaking to an assistant rather than typing into a box — written from the situation, which is why each one carries the situation it came from.
Not necessarily. A p-value above 0.05 suggests insufficient evidence to reject the null hypothesis, but it doesn’t prove no effect. Check sample size or data quality.
They’re right to question you. A T-Test only compares two groups. For three, use ANOVA to avoid inflating error rates with multiple tests.
Yes, if you draw incorrect conclusions. A flawed T-Test might lead you to abandon a winning variation or stick with a loser, wasting resources.