

Time Series Analysis is a statistical technique used to analyze data points that are recorded or indexed in chronological order, helping identify patterns and trends over time.
This topic is relevant for statisticians, financial analysts, and researchers in fields like environmental science who need to interpret historical measurements and predict future outcomes.
External context
When developing content on this subject, you must explain that a time series represents discrete-time data—a sequence of observations recorded at successive, equally spaced intervals. It is crucial to provide varied examples, such as stock market indices or daily temperature readings, to illustrate the range of measurements covered by the technique. This emphasizes that the chronological order and consistent spacing of the data are fundamental aspects of time series analysis.
Time series Wikipedia contributors, “Time series”, en.wikipedia.orgLicence01What it is and how it works
Time Series Analysis processes data arranged in chronological order, typically with equal spacing between observations. The method decomposes data into components like trend (long-term direction), seasonality (repeating patterns), and residuals (irregular fluctuations). Analysts use statistical models such as ARIMA, exponential smoothing, or machine learning algorithms to capture these components. For example, a retailer might analyze monthly sales data to identify holiday spikes and predict next quarter revenue. The process involves data preprocessing, model selection, parameter tuning, and validation using historical data.
Time Series Analysis looks at data collected over time to find patterns and predict what will happen next.
02What to do about it
To implement Time Series Analysis, first collect clean, consistent time-stamped data. Use tools like Python's statsmodels or pandas for preprocessing. Split data into training and testing sets to validate models. Start with simple models like moving averages before advancing to complex ones. Monitor model performance using metrics like MAE or RMSE. Update models regularly as new data arrives to maintain accuracy.
03How it is measured or noticed
Look for temporal patterns in your data visualization. Key indicators include autocorrelation plots (ACF/PACF), stationarity tests (ADF test), and decomposition charts. Metrics like mean absolute error (MAE) or root mean squared error (RMSE) quantify model accuracy. In AI search contexts, track how often your brand appears in time-sensitive queries (e.g., 'Q4 sales trends') and whether your content ranks for temporal keywords.
How the record puts it
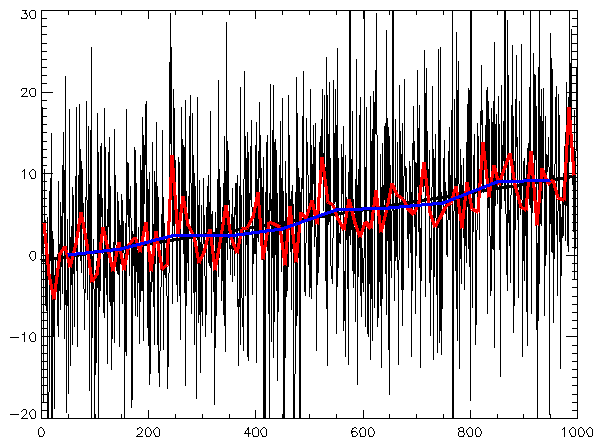
In mathematics, a time series is a sequence of data points indexed, listed, or graphed in chronological order.
04Common mistakes
Avoid these pitfalls when applying Time Series Analysis:
- warn Ignoring seasonality or trend components, leading to inaccurate forecasts
- warn Using non-stationary data without differencing or transformation
- warn Overfitting models by not validating on out-of-sample data
- warn Assuming linear relationships in inherently non-linear time series
05Limits
Time Series Analysis assumes data is stationary (mean/variance constant over time), which often fails in real-world scenarios. It struggles with irregularly spaced data or sudden structural breaks (e.g., pandemics, policy changes). It is frequently confused with cross-sectional analysis, which examines data at a single point in time. Additionally, it cannot account for external variables (e.g., competitor actions) unless explicitly incorporated into the model.
06A worked example
Consider a brand tracking daily website traffic. Using OpenAI's forecasting API, you might input historical traffic data and request a 7-day prediction. The API returns a JSON response with predicted values and confidence intervals. For instance: "predicted_traffic": {"2023-10-01": 15200, "2023-10-02": 14800, ...}. This allows the brand to allocate server resources or schedule content releases based on expected traffic surges.
"Time series forecasting can help anticipate demand fluctuations and optimize resource allocation." — OpenAI API Documentation: https://platform.openai.com/docs/guides/forecasting
The entry above is written by GetLoopLoop. What follows is what independent catalogues hold about the same term — none of it is the source of this page.
- Part of
- time series and spatial modelling, statistics
- Kind of thing
- academic discipline
The same term on Wikipedia
Catalogued in 15 languages07Frequently asked questions
How does Time Series Analysis differ from simple linear regression?
It accounts for temporal dependence and autocorrelation, whereas regression assumes independent observations. It can model trends, seasonality, and lagged effects that regression cannot capture without explicit time variables. Using regression on time‑ordered data often leads to biased estimates and misleading forecasts.
When should I choose Time Series Analysis over other forecasting methods like machine learning models?
Choose it when your data shows clear temporal patterns, you have a sufficient history of evenly spaced observations, and interpretability of components like trend and seasonality matters. If you have limited data or complex nonlinear relationships, machine learning may perform better, but it often requires more tuning and data. The decision depends on data volume, pattern stability, and need for explainability.
What are the key steps to actually perform a Time Series Analysis?
First, visualize the series to spot trends, seasonality, and outliers. Second, make the series stationary via differencing or transformations if needed. Third, select and fit a model (e.g., ARIMA, exponential smoothing) using criteria like AIC. Fourth, validate the model with residual diagnostics and produce forecasts.
Can Time Series Analysis still be useful if my data contains missing values or irregular intervals?
Yes, but you must first address the gaps—either by interpolation, imputation, or using models that handle irregular spacing like state‑space or Gaussian processes. Ignoring missingness can distort autocorrelation estimates and lead to biased forecasts. Proper handling restores the ability to detect underlying patterns.
What are the risks of relying on Time Series Analysis forecasts without checking model assumptions?
If assumptions like stationarity or linearity are violated, forecasts can be systematically off, leading to overstock or stockouts in inventory, or misguided budget allocations. You would notice the error by tracking forecast accuracy metrics (e.g., MAPE) rising over time or seeing consistent bias in residuals. Regularly re‑evaluating the model prevents costly mistakes.
Wikimedia Commons
Related visuals with source and licence credit

08Asked out loud
The same term in the words somebody uses speaking to an assistant rather than typing into a box — written from the situation, which is why each one carries the situation it came from.
It depends on whether the shift reflects a real change in demand or just random noise. Check for recent promotions, supply disruptions, or data entry errors before concluding a true shift. If the deviation persists after accounting for known events, a time‑series model can help separate signal from noise.
It depends on how much data you have and whether the series has been adjusted for inflation or other trends. Detrending and smoothing can reveal hidden seasonality that raw numbers obscure. Try aggregating to quarterly totals or applying a seasonal decomposition to see the pattern.
Usually, you can increase confidence by checking the forecast’s prediction intervals and back‑testing on recent history. Narrow intervals and low past error suggest the model is reliable. If intervals are wide, consider gathering more data or adjusting safety stock levels.