

Correlation is a statistical relationship between two random variables, generally measuring the extent to which they are linearly related.
This information is useful for individuals analyzing data patterns, particularly in AI search contexts, who need to understand relationships without assuming direct cause and effect.
External context
For someone working on their own pages, understanding correlation means recognizing that while two variables may show an association—meaning one's variability can be accounted for by the other—it is a statistical relationship, not proof of causation. It helps users identify patterns where quantities appear to change together.
Correlation Wikipedia contributors, “Correlation”, en.wikipedia.orgLicence01What it is and how it works
At its core, correlation measures the strength and direction of a linear relationship between two data points. For instance, if we track your brand's mention frequency (Variable X) against the percentage of times you appear in AI summaries (Variable Y), a positive correlation means that as X rises, Y also tends to rise. The value itself is typically represented by an R-value, ranging from -1 to +1. A value close to +1 indicates a strong positive relationship; -1 indicates a strong negative relationship; and 0 suggests no discernible linear relationship at all. When analyzing AI search data, we are looking for patterns that suggest co-movement—that the variables track each other consistently over time or across different content clusters.
When we say Brand Signal A and Brand Signal B are correlated, it means they move together predictably. If your mention volume goes up (Signal A), and your featured snippet rate also goes up (Signal B), that's a correlation. It does not mean the increase in mentions caused the snippet boost; something else might be driving both.
02What to do about it this week
Do not treat correlation as proof of causality. If you observe a strong positive correlation between publishing long-form guides and increased AI visibility, your immediate action should be to test the mechanism, not just repeat the pattern. Is the guide length driving the result, or is the underlying topic authority (the 'why')? This week, isolate variables. For example, if Brand Signal A correlates with high engagement, try boosting Signal A through a single channel while keeping all other content inputs constant. Then, measure only the change in AI visibility metrics to see if the relationship holds when other factors are controlled.
- Isolate one variable at a time: Test changes in topical depth without changing content volume.
- Look for mediating variables: Identify potential third factors (like timely news events or platform algorithm updates) that might be influencing both your signals.
03How it is measured or noticed
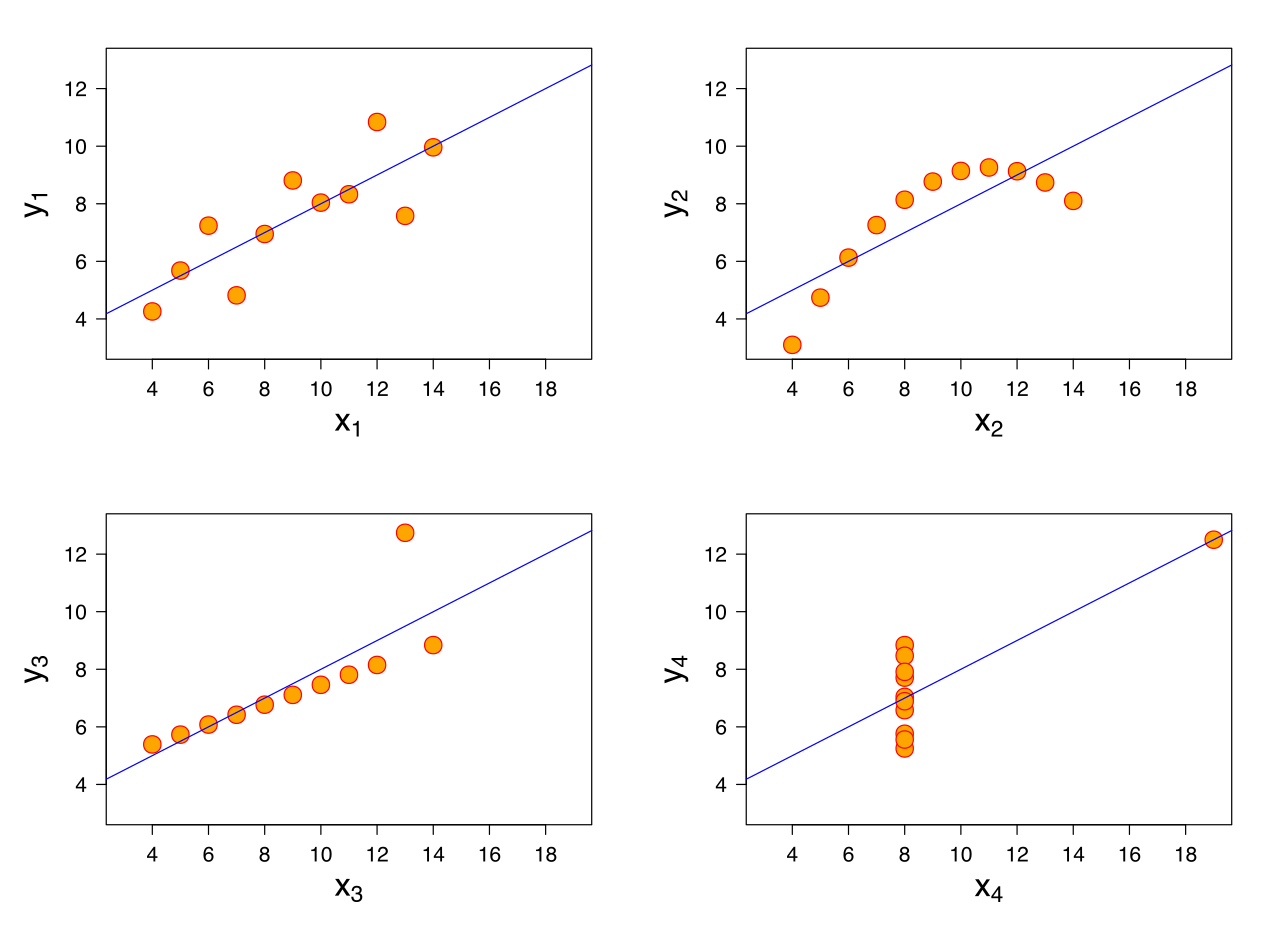
You notice correlation by plotting data points on a scatter plot. Each point represents one observation (e.g., one month). The closer the dots cluster along an imaginary straight line, the stronger the positive or negative correlation. Statistically, you look at the Pearson product-moment correlation coefficient (r). A value of 0.8 suggests that for every unit increase in Brand Signal X, there is a predictable increase in Brand Signal Y. When reviewing vendor dashboards, always check if the platform provides this R-value alongside any observed relationship. If it only shows raw percentage changes without an underlying statistical measure, treat the observation with caution.
How the record puts it
In statistics, correlation is a type of statistical relationship between two random variables or bivariate data.
04Common mistakes to avoid
Mistaking correlation for causation is the most common error in performance marketing. This assumption leads to wasted resources because you are optimizing for a symptom, not the root cause. Always remember that data shows what happened together, never why it happened.
- Do not assume 'Because A and B increased together, A caused B.' Instead, ask: What external factor (C) could have caused both A and B?
- Avoid focusing only on the strongest correlation. Sometimes a weaker, but more direct, relationship is actionable.
05When it does not apply (The limits)
Correlation fails when the relationship is non-linear, or when a 'confounding variable' is at play. A confounding variable is an unmeasured factor that influences both variables being studied, creating a false correlation. For example, if you notice high AI visibility and increased traffic during summer months, the strong correlation might not be due to your content structure; it could simply be seasonal consumer behavior (the confounder). Furthermore, two variables can have zero correlation but still be deeply related in a complex way that simple linear models cannot detect.
06A worked example
Consider this scenario: You notice that every time your site publishes content structured using detailed Schema.org/Article markup (Variable A), your average AI search inclusion rate increases by 15% (Variable B). The correlation is strong and positive. However, before implementing a full strategy change, you must confirm if the schema itself is the cause, or if it's merely that high-quality content inherently requires structured data, and it's the quality that drives both variables. You need to test quality independently of the markup structure.
If Brand Signal A correlates with increased AI visibility, investigate whether a third variable (like timely PR coverage) is driving both signals simultaneously.
The entry above is written by GetLoopLoop. What follows is what independent catalogues hold about the same term — none of it is the source of this page.
- Also called
- correlation and dependence, dependence, positive correlation, negative correlation
- Part of
- statistics, probability theory
- Kind of thing
- mathematical concept, type of relation, scientific concept
The same term on Wikipedia
Catalogued in 69 languages07Frequently asked questions
If we see a strong link between improving our site speed and higher AI search visibility, can we assume that faster loading times are directly causing the increase?
No, you cannot assume direct causation just because of a strong correlation. Correlation only indicates that two variables change together, but it does not prove that one variable is responsible for the change in the other. There might be an unmeasured 'confounding variable'—like increased overall brand authority or seasonal search interest—that is actually driving both improvements.
What specific metrics should I look at to determine if a relationship between two variables is truly linear, and thus measurable by correlation?
You should first visualize the data using a scatter plot to check for linearity. If the points form a clear straight line (either upward or downward), then calculating a correlation coefficient is appropriate. However, if the pattern curves or clusters irregularly, the relationship is non-linear, and standard correlation metrics will be misleading.
If we implement a major content update across all our product pages, how long should we wait before analyzing potential correlations with AI search inclusion data?
It depends on the nature of the change and the volume of fresh data. For significant structural changes, you generally need to allow enough time for Google's indexing and AI models to notice and incorporate the update, which can take weeks. Meanwhile, it is best to monitor leading indicators like crawl rate or immediate organic traffic shifts rather than waiting solely on inclusion metrics.
Is there a way to quantify how much of one variable's change is not explained by another, if I suspect confounding variables are at play?
Yes, techniques like partial correlation or multiple regression analysis can help isolate the unique relationship between two variables while statistically controlling for the influence of one or more confounders. These advanced methods allow you to determine if a link still exists even after accounting for other known factors in your data set.
If our market shifts and AI search becomes less common, will correlation analysis remain a useful tool for understanding brand performance?
Correlation remains fundamentally valuable because it is a mathematical tool for identifying patterns, regardless of the specific channel. Even if AI search changes dramatically, analyzing how different content types or structural elements relate to each other's performance in any major search environment will still be useful for pattern recognition.
Wikimedia Commons
Related visuals with source and licence credit
![The dataEllipse function from Fox and Weisberg (2019)[1] was used to compute confidence ellipses around data from Brunz (1974) [2] (the AIRQUALITY dataset in the R base package).](https://upload.wikimedia.org/wikipedia/commons/b/bc/Correlation_ellipses.png)
08Asked out loud
The same term in the words somebody uses speaking to an assistant rather than typing into a box — written from the situation, which is why each one carries the situation it came from.
No, that is not proof of causation; it only shows correlation. While updating your copy might be related to higher visibility, something else—perhaps a concurrent increase in overall site authority or external linking—could be driving both factors. You need further analysis to isolate the true cause.
You determine the strength by calculating the correlation coefficient; a value closer to +1 or -1 indicates a very strong linear relationship. If the number is close to zero, the variables are not strongly related, and relying on that pattern for strategic decisions would be risky.
You need to explain that you can only demonstrate a correlation, not definitive proof of cause. You should show that the variables move together, but caution your manager that other factors—like seasonal trends or competitor changes—could be equally responsible for the observed pattern.