

Regression Analysis is a statistical method used to estimate and quantify the relationship that exists between an outcome variable, known as the dependent variable, and one or more influencing factors, called independent variables.
Individuals reading about this topic are typically data analysts, statisticians, or marketing professionals who are engaged in building predictive models or conducting advanced quantitative research.
External context
For someone working on their own analytical pages, understanding regression allows them to move beyond simple correlation by quantifying the specific influence of multiple variables on a single outcome. It provides a structured framework for modeling how changes in input factors predict corresponding changes in results.
Regression analysis Wikipedia contributors, “Regression analysis”, en.wikipedia.orgLicence01What it is and how it works
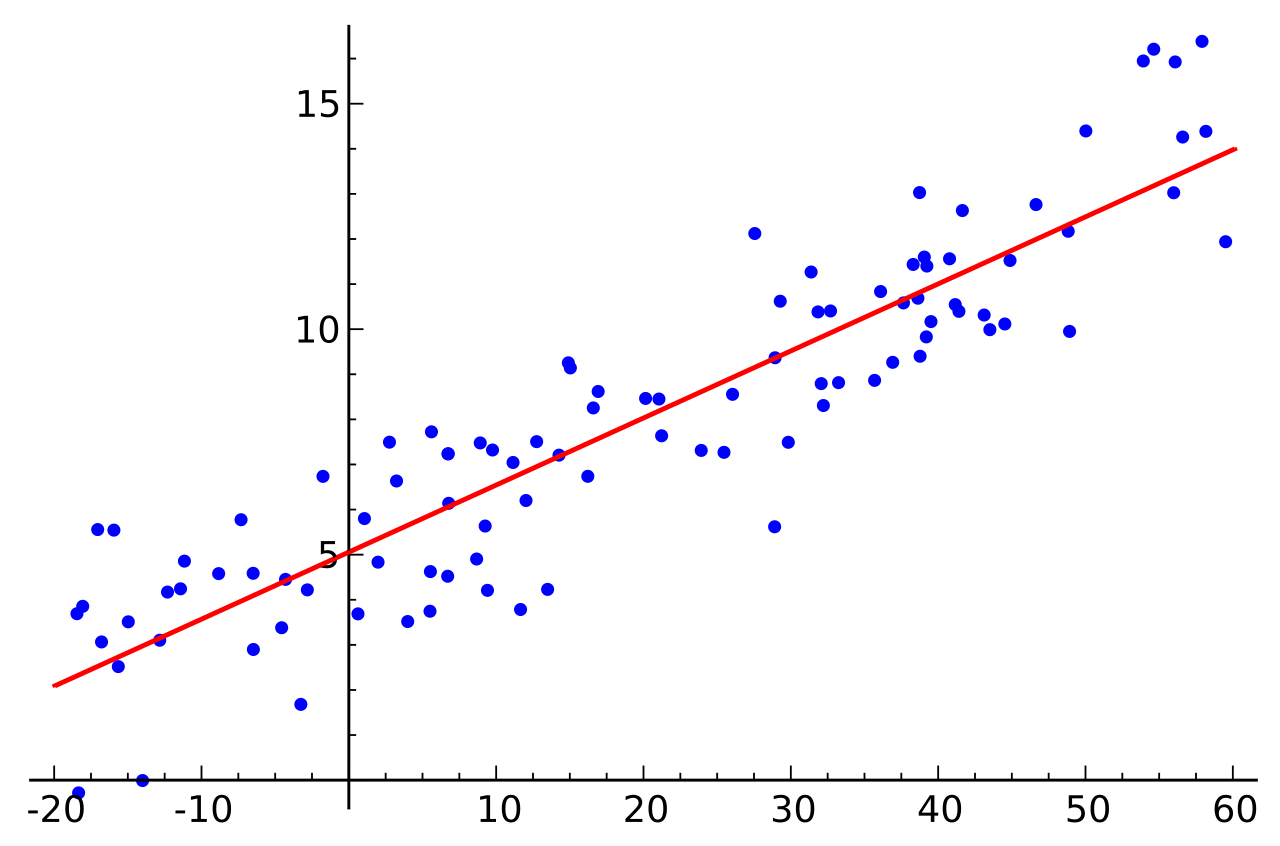
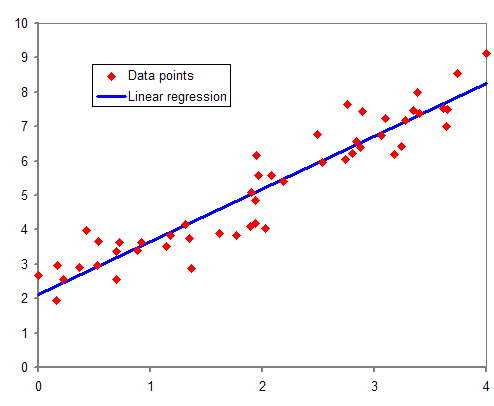
Regression Analysis fits a line or curve to data points, estimating a formula that predicts the dependent variable from independent variables. In marketing, the dependent variable might be click‑through rate, while independent variables could be ad spend, keyword relevance, or page load time. The model calculates coefficients that tell how much the dependent variable changes when an independent variable changes by one unit, holding others constant. It also checks assumptions like linearity, independence, and normality of residuals. If the assumptions hold, the formula can be used to forecast future performance under different conditions.
Regression Analysis shows how changes in one thing affect another, so you can guess future results.
02What to do about it
1. Gather clean data from your analytics tools for the variables you care about. 2. Decide which variable is the outcome you want to predict. 3. Use a spreadsheet or statistical software to run a regression, entering the outcome and predictors. 4. Review the coefficient values and their p‑values to see which predictors are statistically significant. 5. Look at the R‑squared value to gauge how much of the outcome’s variation the model explains. 6. Apply the model: adjust ad spend or keyword bids in line with the coefficients that drive the highest return. 7. Re‑run the regression monthly to capture changes in user behavior or search algorithms.
03How it is measured or noticed
Key indicators include the R‑squared (the proportion of variance explained), the p‑values (significance of each predictor), the regression coefficients (direction and magnitude of influence), and the residual plot (shows if the model fits well). A high R‑squared and low p‑values for key predictors mean the model is useful. Residuals that scatter randomly around zero suggest the assumptions are met.
How the record puts it
In statistical modeling, regression analysis is a statistical method for estimating the relationship between a dependent variable and one or more independent variables.
04Common mistakes
- Using variables that are highly correlated with each other, which inflates standard errors.
- Treating a correlation as proof of causation without testing the model’s assumptions.
- Running regression on too few data points, which makes the results unstable.
- Ignoring outliers that can distort the slope and intercept.
- Failing to check the residuals for patterns that indicate a poor fit.
05Limits
Regression Analysis assumes a linear relationship; it struggles with purely non‑linear patterns unless transformed. It also requires a reasonable sample size—small campaigns produce noisy estimates. Categorical variables must be encoded properly; otherwise the model misinterprets them. Finally, regression can be confused with simple correlation; a high correlation does not guarantee a predictive model.
06Worked example
"In a recent campaign, we used regression analysis to predict conversion rate based on ad spend and landing page load time. The model showed a coefficient of 0.003 for ad spend, meaning each additional dollar increased conversions by 0.3%, while a 1‑second increase in load time decreased conversions by 1.2%. Adjusting bids and speeding the page lifted conversions by 8% over the next month."
The entry above is written by GetLoopLoop. What follows is what independent catalogues hold about the same term — none of it is the source of this page.
- Also called
- regression method, regression
- Named after
- Regression Towards Mediocrity in Hereditary Stature
- Kind of thing
- type of statistical method
The same term on Wikipedia
Catalogued in 55 languages07Frequently asked questions
What is the difference between regression analysis and correlation analysis?
Regression analysis is not the same as correlation analysis; while correlation measures the strength of a linear relationship, regression predicts a dependent variable based on one or more independent variables. It provides coefficients that quantify how changes in predictors affect the outcome, whereas correlation only gives a single coefficient of association.
Should I use regression analysis for my brand sentiment data?
It depends on the nature of your data. If you have a numeric outcome you want to predict—like sentiment score—and you suspect it depends on factors such as ad spend, seasonality, or competitor activity, regression can be useful. However, if your outcome is categorical, consider logistic regression or other classification methods.
How do I perform a simple linear regression in my analytics tool?
Usually you start by selecting the dependent variable and one independent variable, then run the regression function that estimates the slope and intercept. The output will show the regression equation, R‑squared, and p‑values for the coefficient. You can then use the equation to predict new values.
Does regression analysis still work with noisy AI search data?
Yes, regression can handle noise, but its accuracy depends on the signal‑to‑noise ratio. You should check residual plots and consider regularization techniques if the model overfits. If the noise is too high, the predictions may become unreliable.
What could go wrong if I misinterpret regression coefficients?
Misinterpreting coefficients can lead to wrong strategic decisions, such as overinvesting in a factor that actually has a negative effect. You would notice this when the predicted outcomes consistently diverge from actual results, prompting a re‑evaluation of the model or data.
Wikimedia Commons
Related visuals with source and licence credit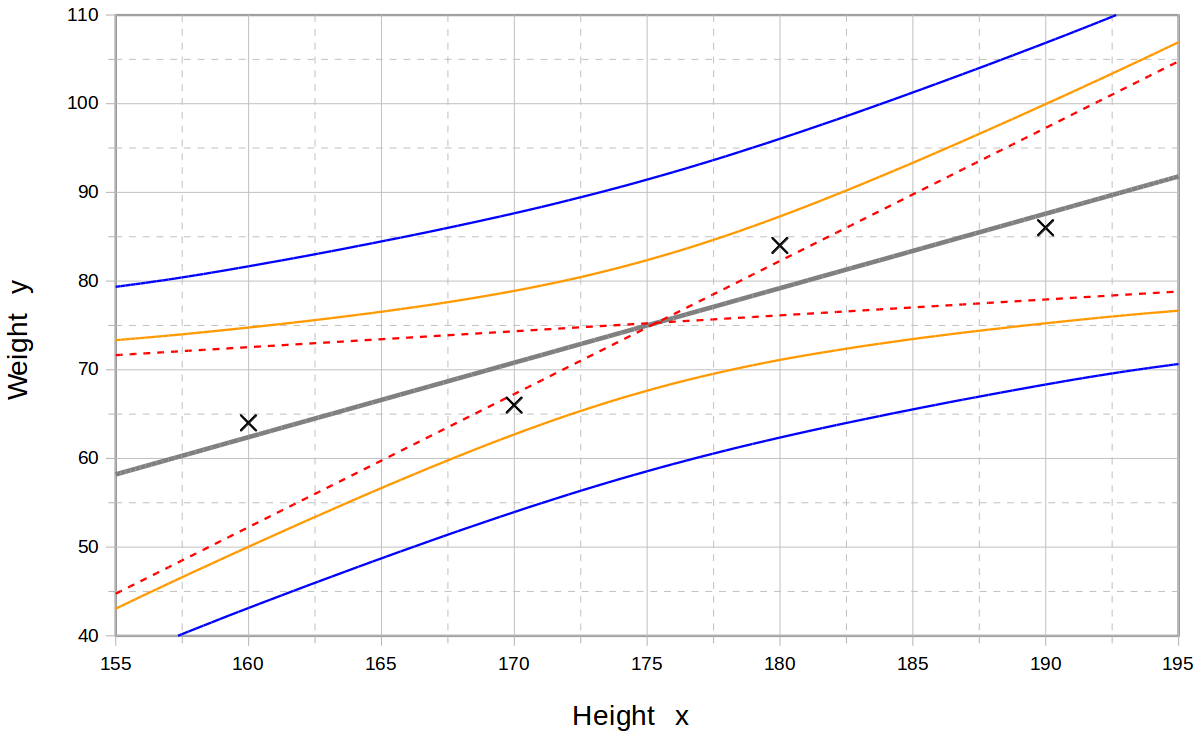
08Asked out loud
The same term in the words somebody uses speaking to an assistant rather than typing into a box — written from the situation, which is why each one carries the situation it came from.
Yes, check the trend line from the latest regression output; a positive slope with a low p‑value indicates improving visibility. If the slope is flat or negative, tweak your SEO tactics before the launch.
It depends on the regression model that links spend to search volume; if the coefficient for spend is positive and significant, spend is contributing. If not, the relationship may be weak.
No, a dip in rankings could be due to algorithm changes or increased competition; the regression analysis can separate the effect of your own factors from external ones. Review the model’s residuals to see if the dip is explained by known variables.