

Logistic regression is a statistical classification algorithm that models the probability of a binary outcome by estimating parameters based on the log-odds of an event.
Individuals studying AI search or machine learning typically read this material alongside guides on classification algorithms, particularly when needing to estimate whether input features predict a specific binary result, such as brand visibility in search results.
External context
For those working with logistic regression, the process involves modeling a single binary dependent variable (coded as 0 or 1) using independent variables that can be continuous or binary. The model estimates parameters by relating these inputs to the log-odds scale, which is measured in units called logits. This relationship is then converted into an interpretable probability value that falls between 0 and 1 via the logistic function.
Logistic regression Wikipedia contributors, “Logistic regression”, en.wikipedia.orgLicence01What it is and how it works
Logistic regression uses the logistic function to map any real-valued input to a value between 0 and 1, representing a probability. The model learns coefficients for each input feature — such as brand mention frequency, sentiment score, or backlink count — by maximizing the likelihood of the observed outcomes in training data. For a given set of features, the model computes a linear combination and passes it through the logistic function: P = 1 / (1 + e^(-z)), where z is the weighted sum of features plus an intercept. The output is the predicted probability that the brand appears in the AI search result. The coefficients indicate the direction and strength of each feature's influence. For example, a positive coefficient for brand mentions means more mentions increase the probability of appearance.
Logistic regression is a way to predict yes/no questions using math. It takes data about a brand and outputs a probability that the brand shows up in AI search.
02What to do about it
Start by collecting historical data on brand appearances in AI search results along with candidate features: brand mentions in training data, domain authority, structured data markup, and recent press coverage. Train a logistic regression model using a library like scikit-learn or a platform's built-in classification tool. Examine the learned coefficients to identify which features have the strongest positive or negative impact. Use those insights to prioritize actions: if sentiment score has a large positive coefficient, invest in positive brand sentiment campaigns; if competitor mentions have a negative coefficient, reduce association with competitors. Validate the model with a holdout set and monitor its performance over time as search algorithms evolve.
03How it is measured or noticed
Logistic regression performance is measured with classification metrics. Accuracy tells the proportion of correct predictions, but for imbalanced data (rare brand appearances) precision and recall are more informative. The Area Under the Receiver Operating Characteristic curve (AUC-ROC) summarizes the model's ability to distinguish between appearance and non-appearance across thresholds. Additionally, the sign and magnitude of each coefficient show which features drive the prediction. A coefficient of 0.5 for brand mentions means a one-unit increase in mentions multiplies the odds of appearance by e^0.5 ≈ 1.65. Statistical significance tests (p-values) on coefficients help decide if a feature is reliably predictive.
How the record puts it
In statistics, a logistic model is a statistical model that models the log-odds of an event as a linear combination of one or more independent variables.
04Common mistakes
- Treating logistic regression as a causal model — coefficients show correlation, not causation.
- Ignoring feature scaling — logistic regression is sensitive to large differences in feature ranges.
- Assuming linear relationships — logistic regression captures only linear effects on the log-odds scale.
- Using too few training samples — logistic regression requires at least 10 events per feature to avoid overfitting.
- Misinterpreting the probability output as a hard classification without considering the threshold.
05Limits
Logistic regression assumes a linear relationship between features and the log-odds of the outcome. It cannot capture complex interactions or non-linear patterns unless feature engineering creates interaction terms. Multicollinearity — high correlation among features — inflates coefficient standard errors and makes interpretation unreliable. For rare events (e.g., brand appears in only 1% of queries), logistic regression can underestimate probabilities unless special techniques like Firth's correction are used. It is often confused with linear regression, which predicts continuous values, not probabilities. In AI search, logistic regression may serve as a baseline but advanced models like gradient-boosted trees or neural networks often outperform it when data is abundant.
06A worked example
Suppose we train a logistic regression to predict whether Brand X appears in AI search results. Features: brand mention count (M), domain authority (D), and negative sentiment score (S). Learned coefficients: intercept = -2.0, M = 0.8, D = 0.3, S = -0.5. For a query with M=3, D=70, S=0.2, z = -2.0 + 0.83 + 0.370 - 0.5*0.2 = -2.0 + 2.4 + 21.0 - 0.1 = 21.3. Probability = 1 / (1 + e^(-21.3)) ≈ 0.999. The model predicts Brand X will almost certainly appear. The high coefficient for domain authority shows it strongly drives appearance.
The entry above is written by GetLoopLoop. What follows is what independent catalogues hold about the same term — none of it is the source of this page.
- Also called
- logit regression, logistic model, logit model, logistic regression
- Kind of thing
- type of statistical model
The same term on Wikipedia
Catalogued in 27 languages07Frequently asked questions
How is logistic regression different from linear regression?
Logistic regression predicts a binary outcome (appear or not), while linear regression predicts a continuous value. Logistic regression uses a logistic function to output probabilities between 0 and 1. It is the right choice when you need to classify whether a brand appears in search results.
Should I use logistic regression or a more complex model like a neural network?
It depends on your data size and interpretability needs. Logistic regression is simpler, faster, and easier to explain, but may underfit complex patterns. Start with logistic regression as a baseline; if performance is insufficient, consider more complex models.
How do I train a logistic regression model for brand appearance prediction?
Collect historical data on brand appearances and features like domain authority, brand mentions, and structured data. Split the data into training and test sets, fit the model using maximum likelihood estimation, and evaluate with metrics like accuracy and AUC.
Does logistic regression still work well for AI search brand appearance prediction?
Yes, it remains a strong baseline, especially when features are linearly related to log-odds. However, if search algorithms become more complex, logistic regression may lose predictive power. Regularly retrain and compare with newer models.
What happens if I use logistic regression incorrectly?
Common mistakes include ignoring feature scaling, multicollinearity, or class imbalance. These can lead to poor predictions or misleading coefficients. Always preprocess data and check assumptions to avoid these issues.
How long does it take to get useful results from logistic regression?
Training is typically fast, often seconds to minutes. However, data collection and feature engineering take longer. You can start seeing initial results quickly after preparing the data.
Wikimedia Commons
Related visuals with source and licence credit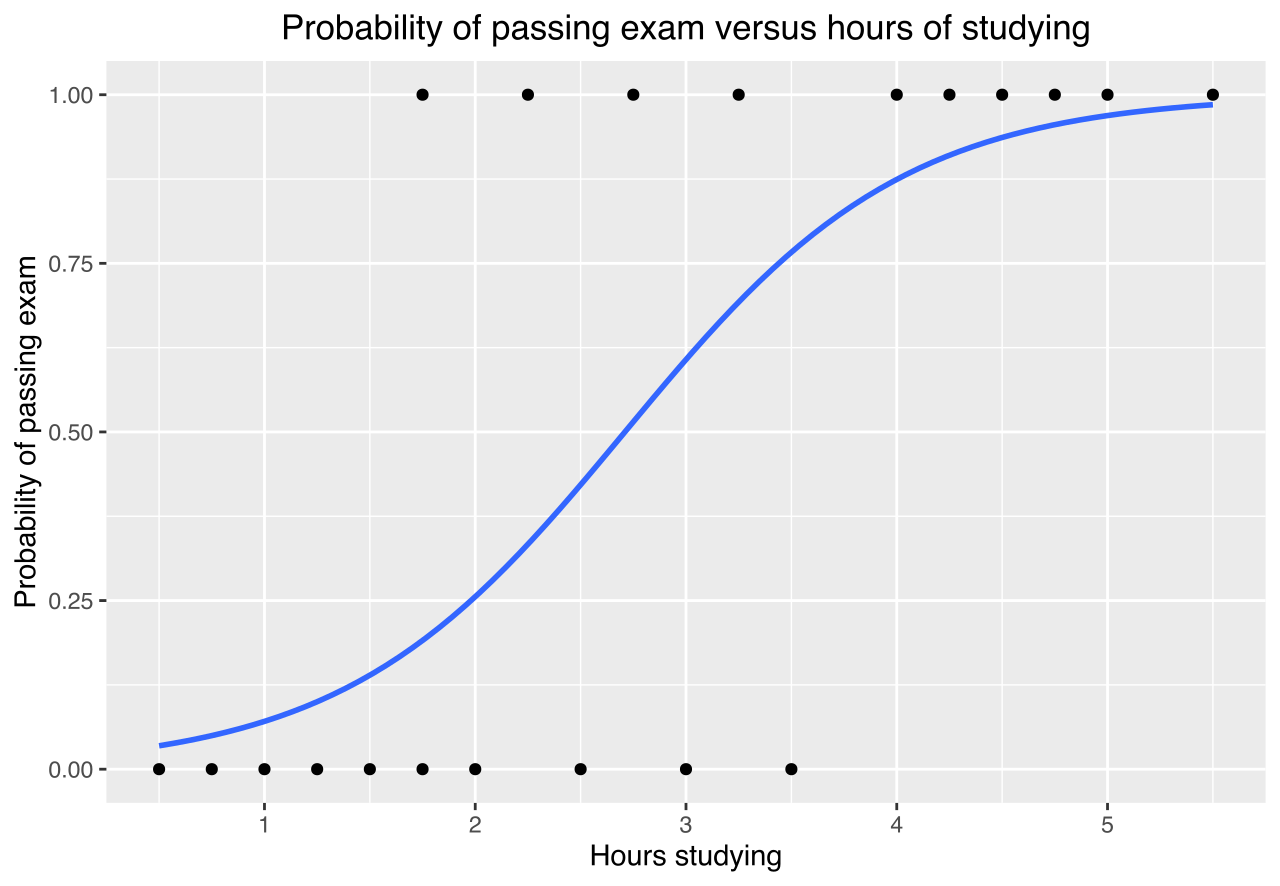


08Asked out loud
The same term in the words somebody uses speaking to an assistant rather than typing into a box — written from the situation, which is why each one carries the situation it came from.
Yes, logistic regression is a good choice. It trains fast and gives you probabilities. Just make sure your features are relevant.
Each coefficient tells you the change in log-odds of appearing for a one-unit increase in that feature. Positive means higher chance, negative means lower. Look at the sign and magnitude to understand impact.
Yes, try logistic regression. It's interpretable and less prone to overfitting with small data. You'll get clear coefficients and can explain each feature's contribution.