

Linear regression is a statistical model that estimates the relationship between a single outcome variable and one or more predictor variables by fitting a straight line to observed data.
This topic is relevant for professionals in brand measurement, SEO, and data analytics who are studying how changes in specific attributes affect search visibility.
External context
For those working with their own pages, this technique helps quantify the relationship between various inputs (explanatory variables) and a single measurable outcome. It distinguishes between simple regression, which uses one predictor variable, and multiple regression, which incorporates two or more variables into the model. By applying this, users can better understand how changes in brand attributes might impact their appearance within AI search results.
Linear regression Wikipedia contributors, “Linear regression”, en.wikipedia.orgLicence01What it is and how it works
Linear regression estimates the coefficients of a linear equation that minimizes the sum of squared differences between observed and predicted values. In the context of AI search brand measurement, you might use simple linear regression with one predictor (e.g., brand sentiment score) and one outcome (e.g., visibility rank). Multiple regression extends this to several predictors, such as mention frequency, recency, and authority. The model outputs an equation like y = β0 + β1x1 + β2x2 + ... + ε, where each β coefficient indicates the expected change in the outcome per unit change in the predictor, holding others constant. Marketers can use this to identify which brand signals most strongly correlate with AI search appearance.
Linear regression finds the straight line that best predicts an outcome based on input factors. For example, it can show how much a brand's mention count in AI summaries influences its search impression share.
02What to do about it
Start by collecting data on brand appearance in AI search (e.g., from a monitoring tool) and potential predictors (e.g., brand mentions, backlinks, social engagement). Run a linear regression using spreadsheet software or a statistical package. Examine the coefficients to see which factors have the largest impact. For instance, if the coefficient for 'brand mentions in AI summaries' is positive and statistically significant, increasing mentions is likely to improve visibility. Use the model to simulate changes: if you increase mentions by 10%, what is the predicted change in impression share? Prioritize actions that yield the highest coefficient per unit effort.
03How it is measured or noticed
Key metrics from a linear regression include the R-squared value, which indicates the proportion of variance in the outcome explained by the predictors. A higher R-squared means the model fits well. The p-value for each coefficient tests whether the effect is statistically significant (typically p < 0.05). The coefficient itself shows the magnitude and direction. In brand measurement, you might notice that a 1-point increase in brand sentiment score is associated with a 3% increase in AI search visibility. Residual plots help check if the linear assumption holds.
How the record puts it
In statistics, linear regression is a model that estimates the relationship between a scalar response and one or more explanatory variables.
04Common mistakes
- Assuming correlation implies causation: a high coefficient does not prove that changing the predictor will cause the outcome to change.
- Overfitting the model by including too many predictors relative to the number of observations, leading to unreliable coefficients.
- Ignoring non-linear relationships: linear regression cannot capture curves or interactions unless you transform variables.
- Failing to check residuals for patterns that violate assumptions like homoscedasticity or independence.
- Using regression on data that is not independent, such as time series without accounting for autocorrelation.
05Limits
Linear regression assumes a linear relationship, independence of errors, constant variance (homoscedasticity), and normally distributed errors. It is sensitive to outliers. It cannot model categorical outcomes (use logistic regression instead). It is often confused with correlation, which only measures strength and direction of association without a predictive equation. In brand measurement, linear regression may not capture complex dynamics like brand interactions or non-linear thresholds. It is best used as an exploratory tool, not a definitive causal model.
06A worked example
A brand tracked weekly data over 12 weeks: number of times the brand appeared in AI-generated search summaries (predictor) and the brand's impression share in organic search (outcome). Linear regression yielded the equation: Impression Share = 0.02 + 0.015 * (AI Mentions). The R-squared was 0.65, and the p-value for the coefficient was 0.003. This suggests that each additional AI mention is associated with a 1.5 percentage point increase in impression share, and the model explains 65% of the variance. The brand then focused on increasing AI mentions by optimizing content for AI-friendly formats.
The entry above is written by GetLoopLoop. What follows is what independent catalogues hold about the same term — none of it is the source of this page.
- Also called
- linear regression method, linear regression analysis
- Kind of thing
- type of statistical method
The same term on Wikipedia
Catalogued in 44 languages07Frequently asked questions
How is linear regression different from correlation?
Correlation measures the strength and direction of a relationship between two variables, while linear regression models the relationship and allows prediction. In brand measurement, correlation tells you if brand mentions and AI appearances move together, but regression tells you how much a change in mentions changes appearance.
Should I use linear regression or logistic regression for predicting brand appearance in AI search?
It depends on your outcome variable. Linear regression is for continuous outcomes (e.g., appearance frequency), while logistic regression is for binary outcomes (e.g., appears or not). If your monitoring tool gives a count of appearances, use linear regression; if it's a yes/no flag, use logistic regression.
How do I actually run a linear regression for brand measurement?
Collect data on your dependent variable (e.g., brand appearance rate) and independent variables (e.g., backlinks, social mentions). Use statistical software or a spreadsheet to fit the model. The output gives coefficients that show how each predictor affects appearance, and an R-squared value indicating overall fit.
Does linear regression still work if my data isn't normally distributed?
Linear regression is robust to non-normal errors with large sample sizes, but severe skewness can affect confidence intervals and p-values. For brand measurement with small datasets, consider transforming the variable or using a non-parametric alternative. Check residual plots to assess normality.
What happens if I violate the assumption of independence in linear regression?
Violating independence, such as using time-series data without accounting for autocorrelation, leads to unreliable standard errors and invalid hypothesis tests. You might falsely conclude a brand attribute is significant. Use techniques like time-lagged variables or autoregressive models to address this.
How much data do I need before linear regression gives reliable results?
A common rule of thumb is at least 10 observations per predictor variable, but more is better for stability. In brand measurement, if you have 5 predictors, aim for 50 data points. Too little data risks overfitting and unreliable coefficients.
Wikimedia Commons
Related visuals with source and licence credit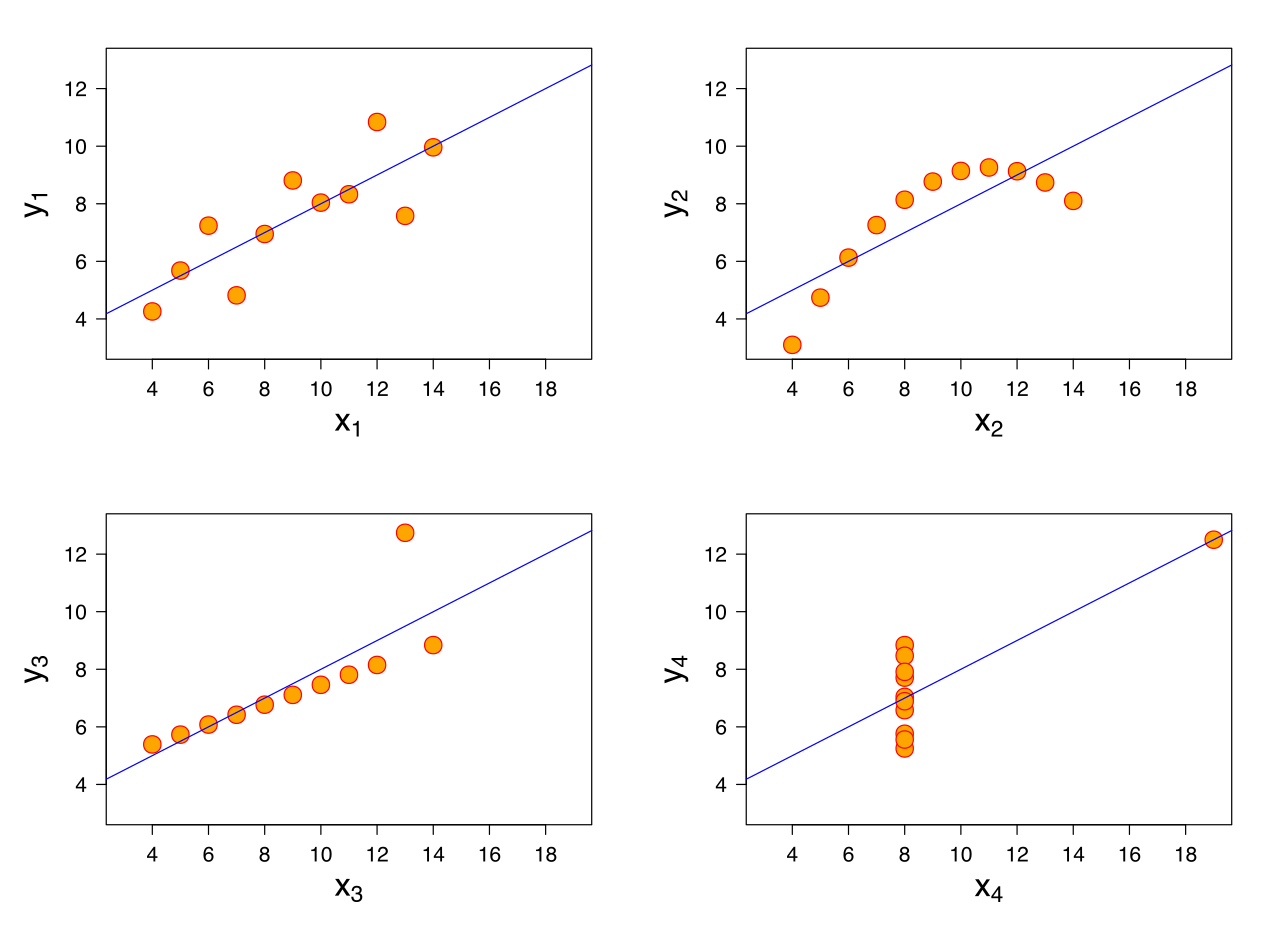

08Asked out loud
The same term in the words somebody uses speaking to an assistant rather than typing into a box — written from the situation, which is why each one carries the situation it came from.
Not necessarily. R-squared tells you how much of the variation in appearances your predictors explain, but it doesn't prove causation. You still need to check that the relationship makes sense and that other factors aren't driving the result.
Yes, linear regression can quantify the relationship between backlinks and brand appearances. If the coefficient for backlinks is positive and significant, you can say that a decrease in backlinks is associated with fewer appearances. But remember correlation isn't causation—other factors might be involved.
No, real-world data rarely forms a perfect line. Linear regression finds the best-fitting straight line through your points, even if they scatter. Check residual plots to see if the pattern is random; if there's a curve, you might need a transformation or a different model.