

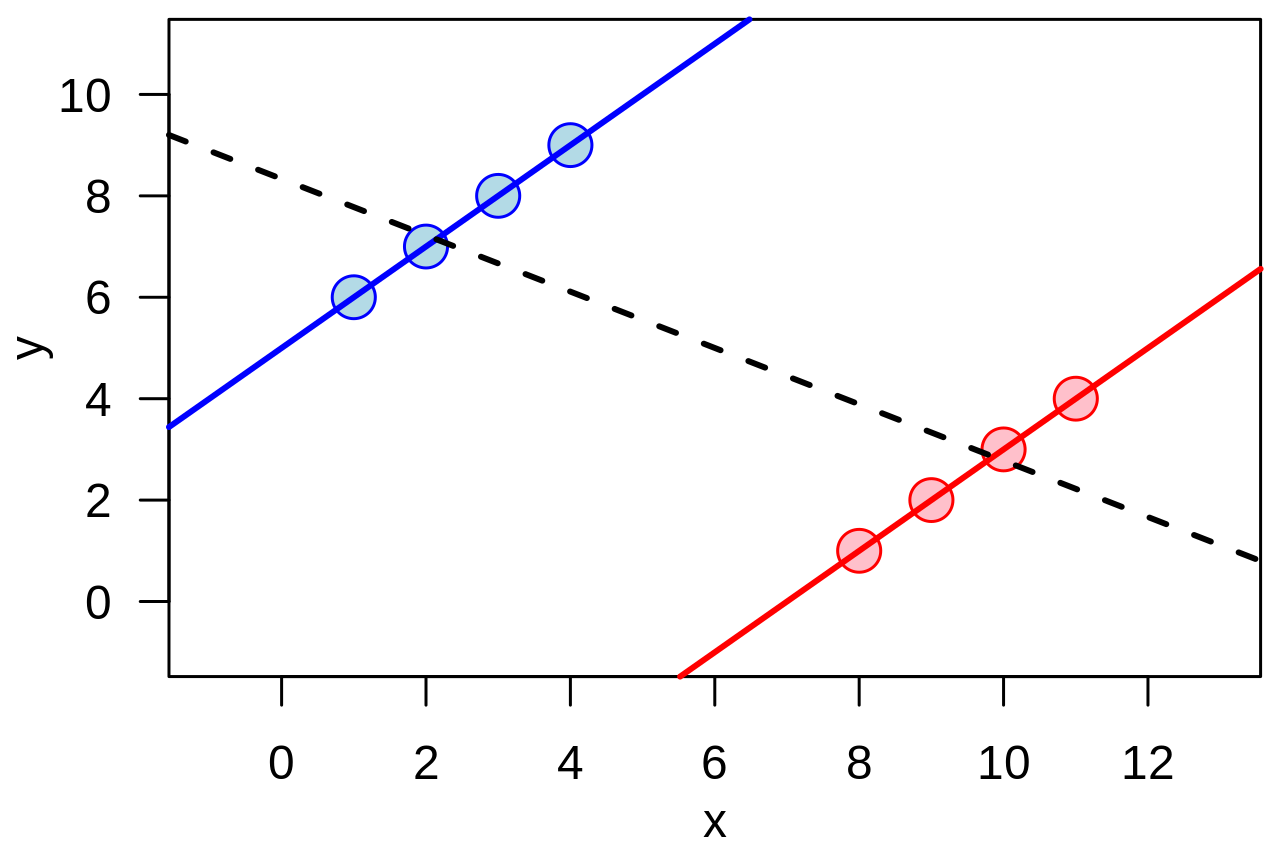
Simpson's Paradox is a statistical occurrence where an apparent pattern or trend observed across multiple distinct data groups vanishes or reverses when those groups are combined into a single dataset.
This concept is relevant for researchers and analysts in fields such as social science, medicine, and statistics who are interpreting frequency data and need to ensure that observed trends are not misleading due to underlying group structures.
External context
For anyone working with statistical data, this paradox serves as a warning that simply combining subgroups can lead to misinterpreting results or missing critical performance failures. To accurately understand the relationship between variables, it is essential to properly address and model any confounding variables and true causal connections within the analysis.
Simpson's paradox Wikipedia contributors, “Simpson's paradox”, en.wikipedia.orgLicence01Understanding the Mechanism
The paradox occurs because a relationship observed in aggregated data does not hold true when the data is analyzed within its component parts. Think of it as weighting. If your total search impressions are dominated by one type of query (e.g., broad, informational queries), that segment's performance will disproportionately skew your overall metrics for all other segments. You might see a high average click-through rate (CTR) across the board, but when you isolate the highly commercial or transactional queries—the ones that actually drive revenue—you may find your brand visibility is significantly lower than anticipated. The mechanism isn't flawed math; it’s an issue of data structure and necessary segmentation.
It’s a warning that just because your overall brand visibility score looks good doesn't mean it's good everywhere. If you group your data incorrectly—for instance, mixing high-intent queries with low-effort informational searches—the resulting average can lie to you about where your real problems are.
02What to Do About It This Week
Do not rely solely on a single 'Total Performance Score.' Your immediate action must be to segment your data by the most critical variables. Instead of looking at overall performance, create segmented views for key dimensions like device type (mobile vs. desktop), query intent (navigational vs. transactional), and search result format (featured snippet vs. standard listing). If you notice a significant drop-off in one specific segment—for example, if your brand appears well in AI summaries but fails to appear at all when users use voice search queries—that is where your immediate optimization effort must go. Always drill down until the data tells a consistent story across multiple dimensions.
03Identifying Potential Paradoxes in Your Data
To detect this pattern, you need to compare two sets of metrics: the aggregate view and several stratified views. Look for instances where the relationship between variables flips when segmentation is applied. For example, if overall brand mention volume seems high, but upon segmenting by 'Search Query Length,' you find that mentions are actually concentrated in very short, direct queries while long-tail content generates zero visibility, a paradox exists. Key metrics to compare include: overall CTR vs. segmented CTR; total impressions vs. segmented impression share; and aggregate ranking position vs. segment-specific average rank.
How the record puts it
Simpson's paradox is a phenomenon in probability and statistics in which a trend appears in several groups of data but disappears or reverses when the groups are combined.
04Common Mistakes to Avoid (Warn)
Marketers often fall into the trap of accepting high-level averages without questioning the underlying data distribution. These mistakes lead directly to misallocated budget and wasted effort.
- warn — Assuming overall performance metrics are sufficient: Never treat a single, combined score as gospel truth. Always check the segments.
- warn — Ignoring query intent: Mixing high-intent (ready to buy) queries with low-intent (just researching) queries in one calculation obscures where your real conversion value lies.
- warn — Over-relying on volume alone: High overall visibility might be driven by massive, non-brand-related search volume that doesn't actually lead to brand recognition or traffic.
05When This Concept Does Not Apply (or is Confused With)
The paradox only applies when the grouping variables are causally related to the outcome being measured. It is often confused with simple correlation or confounding variables, but it specifically relates to how the grouping itself distorts the perceived relationship. If you segment your data by a variable that has no bearing on brand appearance—for instance, the time of day when the search occurred, assuming all other factors are equal—you are unlikely to find a true paradox. The concept requires that the segments themselves represent distinct operational or user groups.
06A Worked Example in AI Search Context
Consider a brand that appears frequently in general AI search summaries. The overall 'Brand Mention Rate' looks excellent (e.g., 85%). However, when you segment the data by user query type, you find that 90% of those mentions come from broad queries like 'best software for X,' where your brand is mentioned merely as one of many options. When you isolate the highly specific, long-tail comparison queries (e.g., 'Brand A vs Brand B'), your actual mention rate drops to 15%. The paradox shows that while overall visibility looks strong due to high volume in general areas, the critical, conversion-driving segments are performing poorly.
Overall brand mentions appear robust (85%), but segmentation by query type reveals a significant drop to 15% in high-intent comparison queries.
The entry above is written by GetLoopLoop. What follows is what independent catalogues hold about the same term — none of it is the source of this page.
- Also called
- Simpson paradox, reversal paradox, amalgamation paradox, Yule–Simpson effect
- Named after
- Edward H. Simpson
- Kind of thing
- paradox
The same term on Wikipedia
Catalogued in 33 languages07Frequently asked questions
How is Simpson's Paradox different from simply finding a correlation between two metrics?
It is not merely about correlation; it involves an underlying structural change in the data distribution. A simple correlation just tells you that X and Y move together, but the paradox shows that this relationship was artificially maintained or reversed because of how the population was grouped—the grouping variable itself changes the observed effect.
If my overall AI search performance score is high, do I still need to segment the data?
Yes, you should always segment your data until you are certain of its stability. A high aggregate score can be misleading if a critical subsection—such as mobile searches or specific question types—is dragging down performance while being masked by strong performance in another group.
What variables should I use to segment my AI search data to detect potential paradoxes?
You must segment by variables that are causally related to the outcome you measure. Ideal segmentation points include device type (mobile vs. desktop), query intent (informational vs. transactional), and geographical region, as these groups often behave differently.
If I find a paradox, does it mean my entire content strategy is failing?
No, finding a paradox only means your analysis needs to be more granular; it doesn't automatically indicate failure. It highlights that the overall metrics are insufficient and directs you to specific areas—like underperforming user segments—where immediate strategic adjustments are needed.
How quickly should I look for a paradox after implementing a major content update?
You need to monitor segmented data continuously, rather than waiting for a large trend. Because the effect can be subtle and dependent on specific user behavior patterns, monitoring weekly or even daily changes in key segments is necessary.
Can I use Simpson's Paradox concept when comparing performance across different months?
Yes, you absolutely can. If your month-over-month comparison is aggregated, a change might appear due to seasonal shifts or changes in the mix of query types (e.g., getting more high-volume vs. low-volume queries), rather than an actual improvement in content quality.
Wikimedia Commons
Related visuals with source and licence credit

08Asked out loud
The same term in the words somebody uses speaking to an assistant rather than typing into a box — written from the situation, which is why each one carries the situation it came from.
You might be running into a Simpson's Paradox, which means your overall positive trend could be hiding significant weaknesses in specific user groups. You need to immediately break down the data by those critical segments—like device or query type—to see where the real performance issues lie.
No, you shouldn't rely solely on that single aggregate number because it risks misleading your audience by hiding disparities between groups. You must segment the data into at least two or three key variables and present those stratified views instead.
You may have been misled by an aggregate view that masked performance failures in lower-volume, but more critical, segments. You need to re-evaluate your strategy and segment the data to see if those niche areas are actually driving the necessary results.