

All scenarios/ Agency
Every client site in one window: portfolio, schedule and notifications
Your agency looks after dozens of client sites, and every morning starts with the same question: where did something break overnight? Opening every site in turn takes too long, and the client often finds the problem before you do. You need one screen that tells you where to look first.
- Who
- An SEO agency or a maintenance studio
- Sites
- Many client sites of different sizes
- What hurts
- You find out what broke when the client calls
- What's needed
- A portfolio that shows which sites got worse
Steps in Molfar
Open Projects
Every site crawled on this computer is a card or a table row. At the top, four numbers for all sites together: sites, average health, Need attention and the next planned scan.
Projects — docs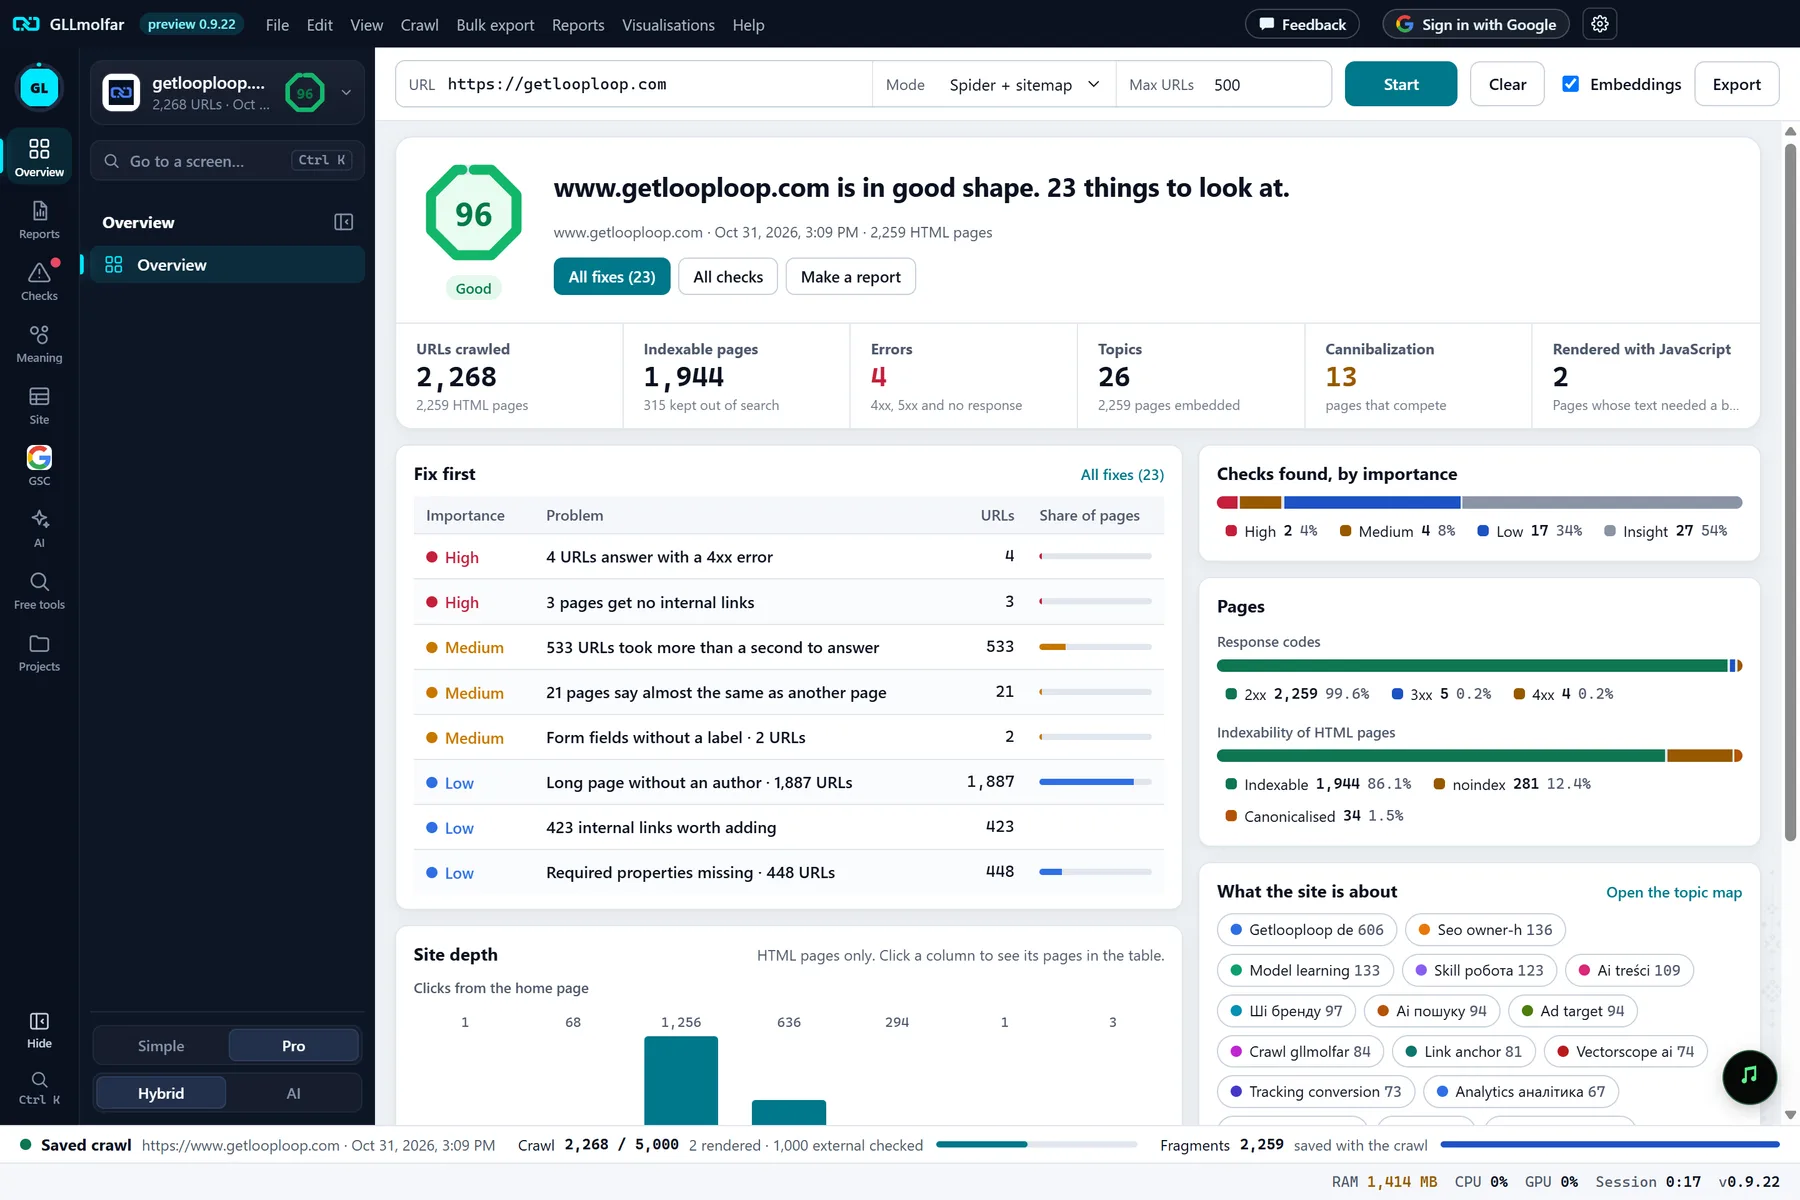
In the screenshot: Overview after a crawl Read the sites that got worse first
The default order is Needing attention first: the sites whose main problem got worse. Each card shows health with its change, pages, errors, not indexable and to fix with their changes since the crawl before, and a Main thing now line.
Projects · Site card — docsIn the screenshot: Overview after a crawl Lay out the crawls in the calendar
Give each site its own schedule: every day, every week or every month at the time you choose. While a planned crawl runs, the panel shows Running now and the sites waiting in line, and the calendar shows past and planned runs.
Schedule — docs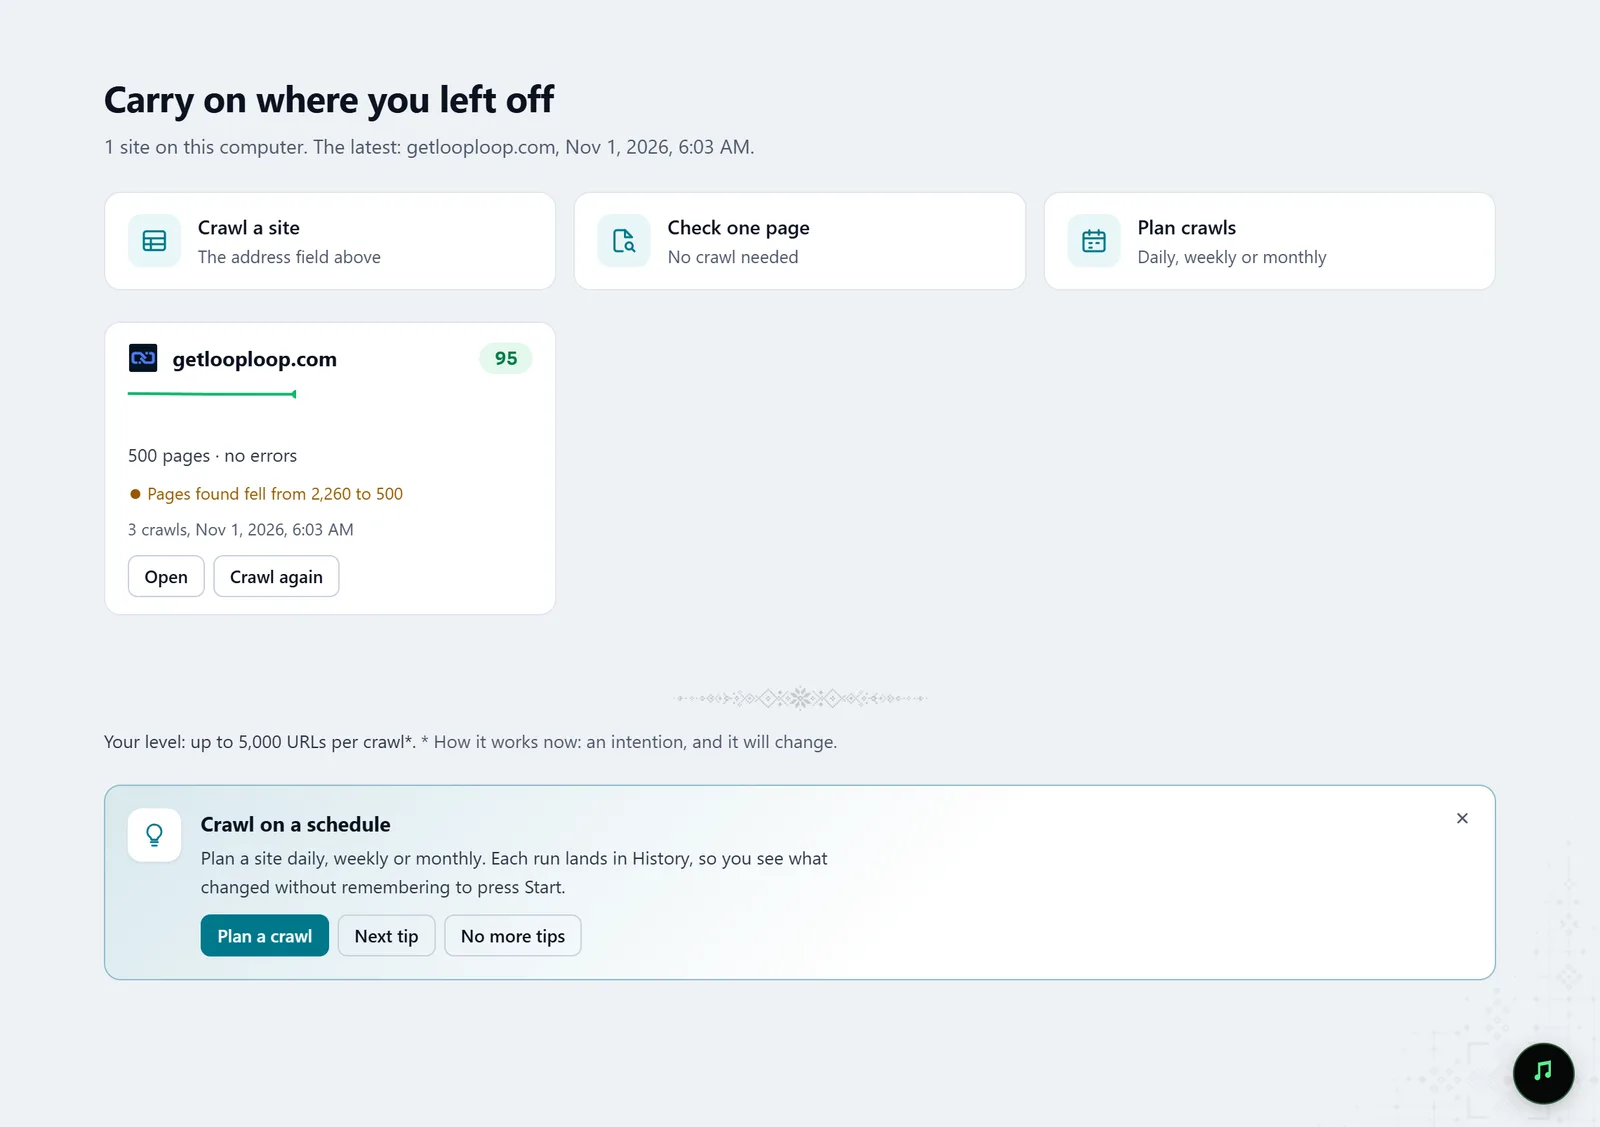
In the screenshot: Starting a crawl Turn on notifications
System notifications report every planned run: started, waiting, done with its counts, missed or did not start. Crawls run while Molfar is open or in the tray.
Settings · Planned crawls — docsIn the screenshot: Starting a crawl Open a site and start with the Fix list
A site's name opens its last crawl. The Fix list numbers what to fix, most important first, with why it matters, how to fix it and the URLs.
Fix list — docs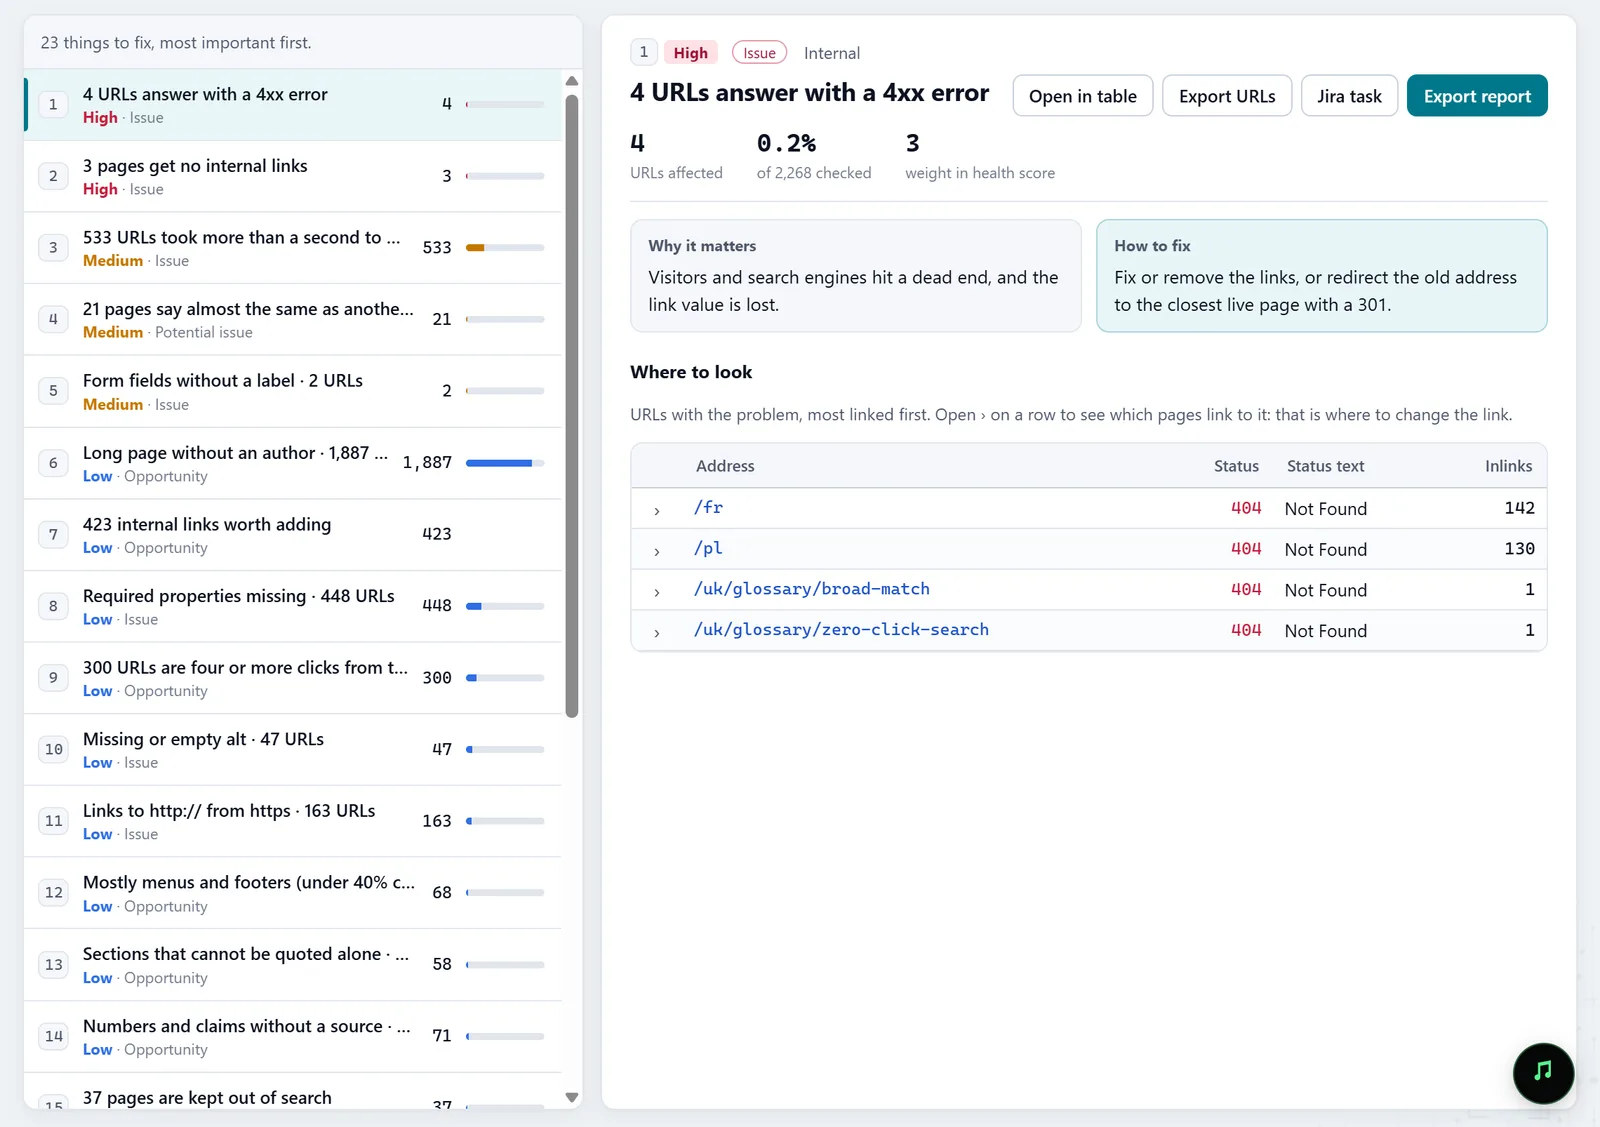
In the screenshot: Fix list Find the section on fire
The heat map draws the site's folders as tiles sized by pages and coloured by the metric you pick: pages without problems, problems per page, Google clicks or lost clicks. The side panel names the hottest folders, and a tile opens their pages.
Heat map — docs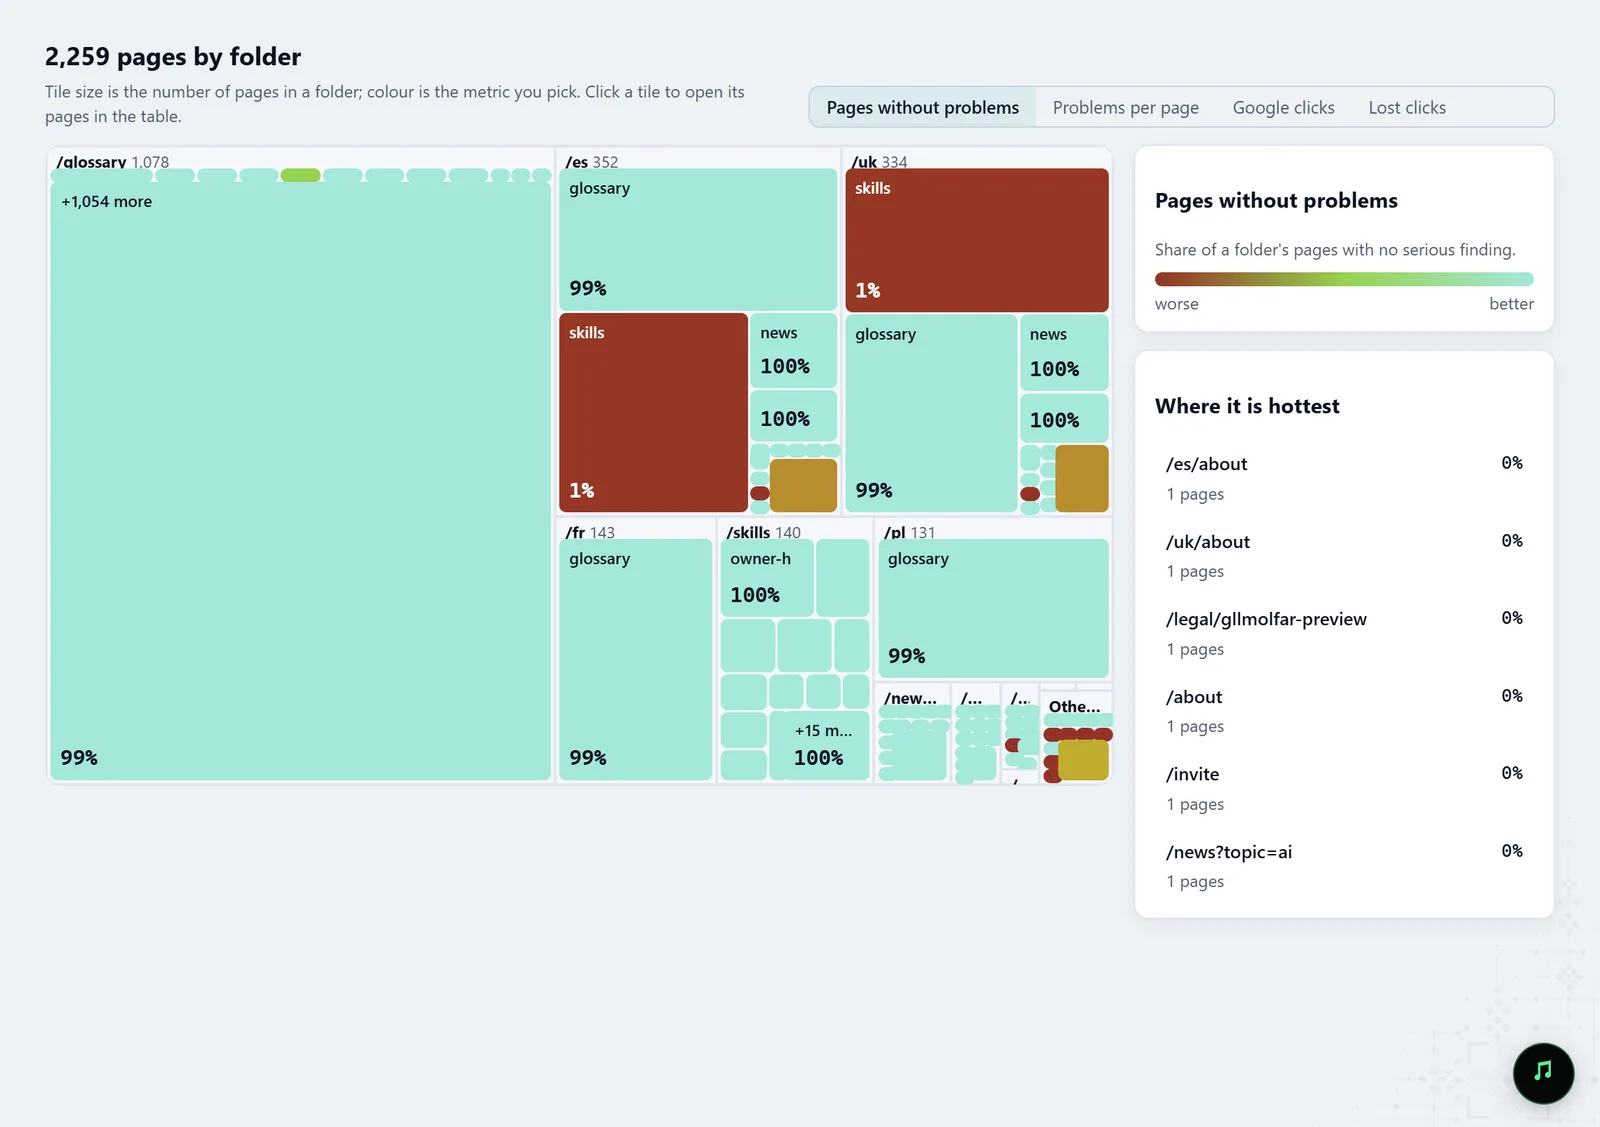
In the screenshot: Heat map of sections
What you get
A morning overview
Every site on one screen, the ones that got worse first.
A schedule that runs itself
Each site crawled on a calendar, with a notification for every run.
What to do with each site
The fix list and the hottest sections for a site that needs attention.
Good to know
- Projects are the sites crawled on this computer: Molfar is a desktop app, and we don't promise shared team access to crawls yet.
- For a domain card, the app looks up the registry record and DNS on its own; only the domain name leaves the computer.
- Planned crawls do not run while the app is closed, so keep it in the tray.
Questions
- What is Main thing now?
- One line on the card that says what to read first about the site; Need attention lists the sites where that problem got worse.
- Can I see the sites as a table?
- Yes: one row per site with health, pages, errors, not indexable, to fix, the last crawl and the next scan.
- What if the computer was off when a crawl was due?
- Choose in the settings: run it as soon as the computer is back, skip it, or skip it and remind you.