

Heat map
Describes GLLmolfar 0.9.22current release 0.9.23 · checked 1 Nov 2026
The crawled site as tiles, one per folder. A tile's size is the number of pages in it; its colour is the metric you pick. The side panel names the folders where it is hottest. A tile opens its pages in the table.
- Where
- Site › Heat map
- Mode
- Simple and Pro
- Built from
- The open crawl, and Search Console when connected
- Changes
- When you open another crawl or pick a metric
On the screen
The heading counts the pages on the map. Under it, the map; on the right, the metric's scale and the folders where it is hottest.
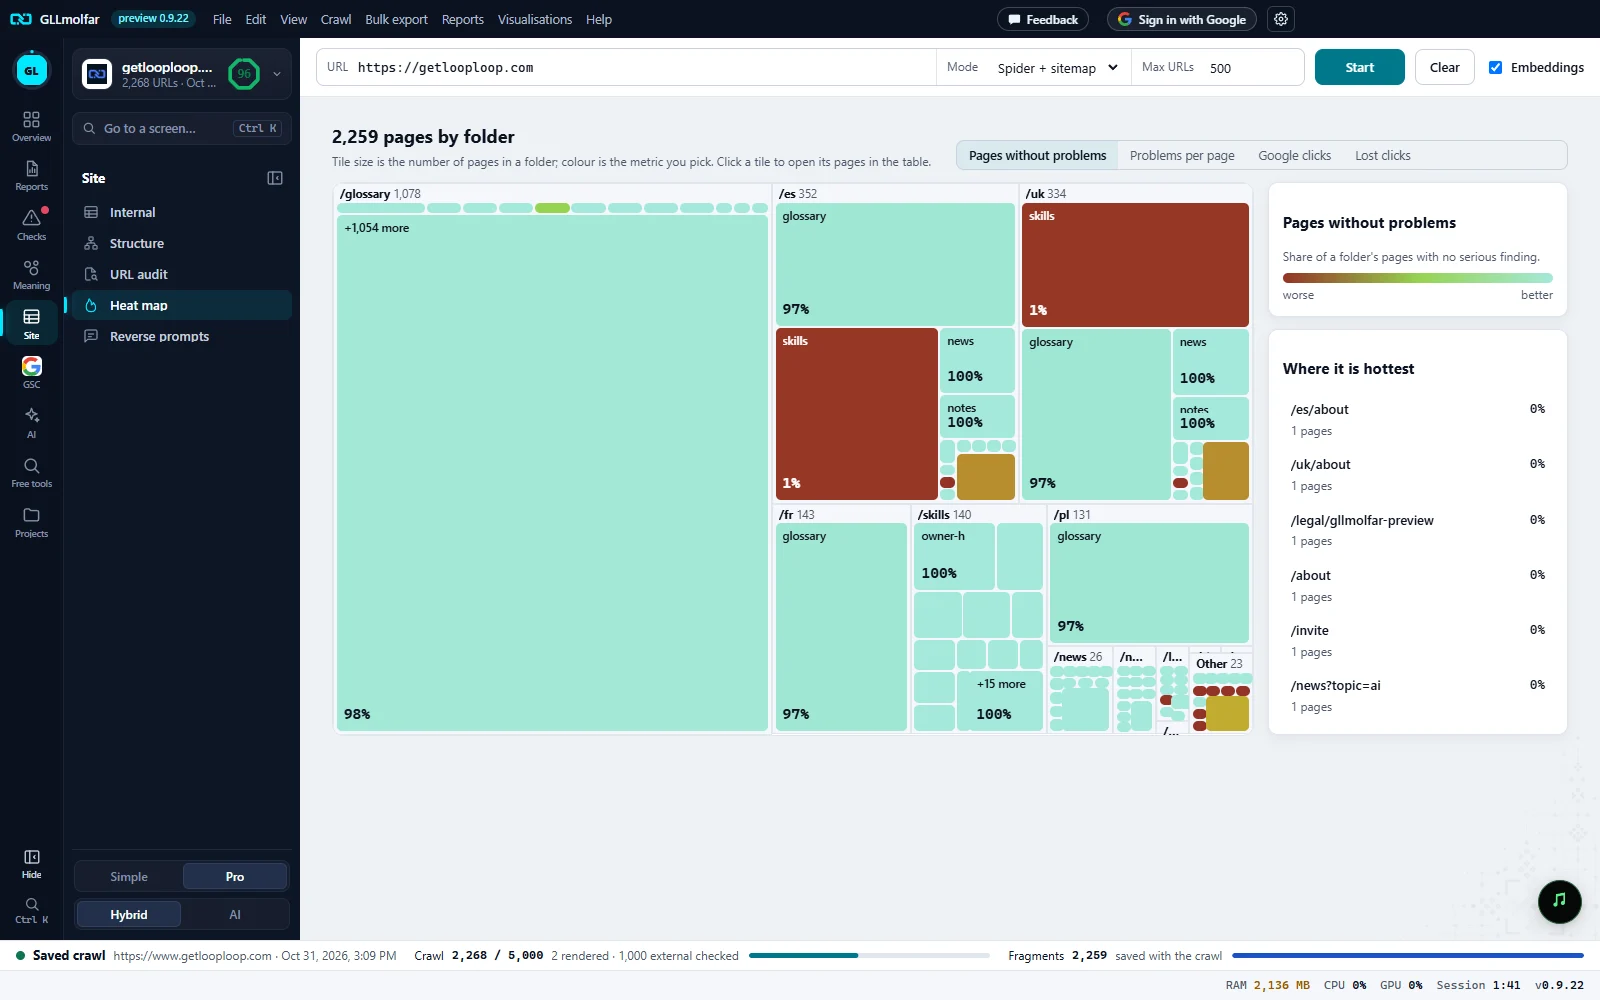
Heading. N pages by folder, and how to read the map.
Colour by. Pages without problems, Problems per page, Google clicks, Lost clicks. The last two need Search Console data for the site.
Folders. Each first-level folder is a frame with its name and page count; the tiles inside are its subfolders, with the value of the metric.
Scale. What the metric means, and its colours from worse to better.
Where it is hottest. Six subfolders where the metric is worst, with the value and the number of pages. A row opens its pages.
Other. Folders past the twelve largest, drawn together as one frame.
Colour by
| Metric | What a tile's value is |
|---|---|
| Pages without problems | Share of a folder's pages with no serious finding. The scale runs from red (worse) to green (better). |
| Problems per page | Average number of findings per page in the folder: the crawl's failed checks and each kind of accessibility finding. |
| Google clicks | Search Console clicks of the folder's pages, last 28 days. From the same report as Search Console › Performance. |
| Lost clicks | Clicks the folder's pages lost against the 28 days before, page by page as in Lost clicks. |
How the tiles are grouped
- Only HTML pages that answered 200 are on the map.
- Pages are grouped by the first segment of their address, then by the second. The home page is the
/frame. - The twelve largest folders get a frame each; the rest are drawn together as Other.
- Inside a frame, the twelve largest subfolders get a tile each; the rest share one tile labelled +N more.
- Small tiles show no text. Hovering any tile gives its folder, its pages and its value.
- A tile, or a row of Where it is hottest, opens its pages in the table.
States and messages
Crawl a site to see its heat map.
The tab needs the pages of a crawl.
Connect Search Console for this site to colour by clicks.
No Search Console data for this site, live or saved: the two click metrics cannot be picked.