

Search Console: Visualisation
Describes GLLmolfar 0.9.22current release 0.9.23 · checked 1 Nov 2026
The period's queries drawn instead of listed: the words they are made of, how they spread over position, CTR and impressions, position against CTR with the queries one step from more clicks, how concentrated clicks are, query length, and brand and questions against the rest.
- Where
- GSC › Visualisation
- Mode
- Simple and Pro
- Built from
- The queries the saved report already holds; nothing is fetched
- Changes
- With the period, and on Refresh
On the screen
The charts follow the period buttons in the shared head (see Performance). The first is the treemap of words; the others follow below it.
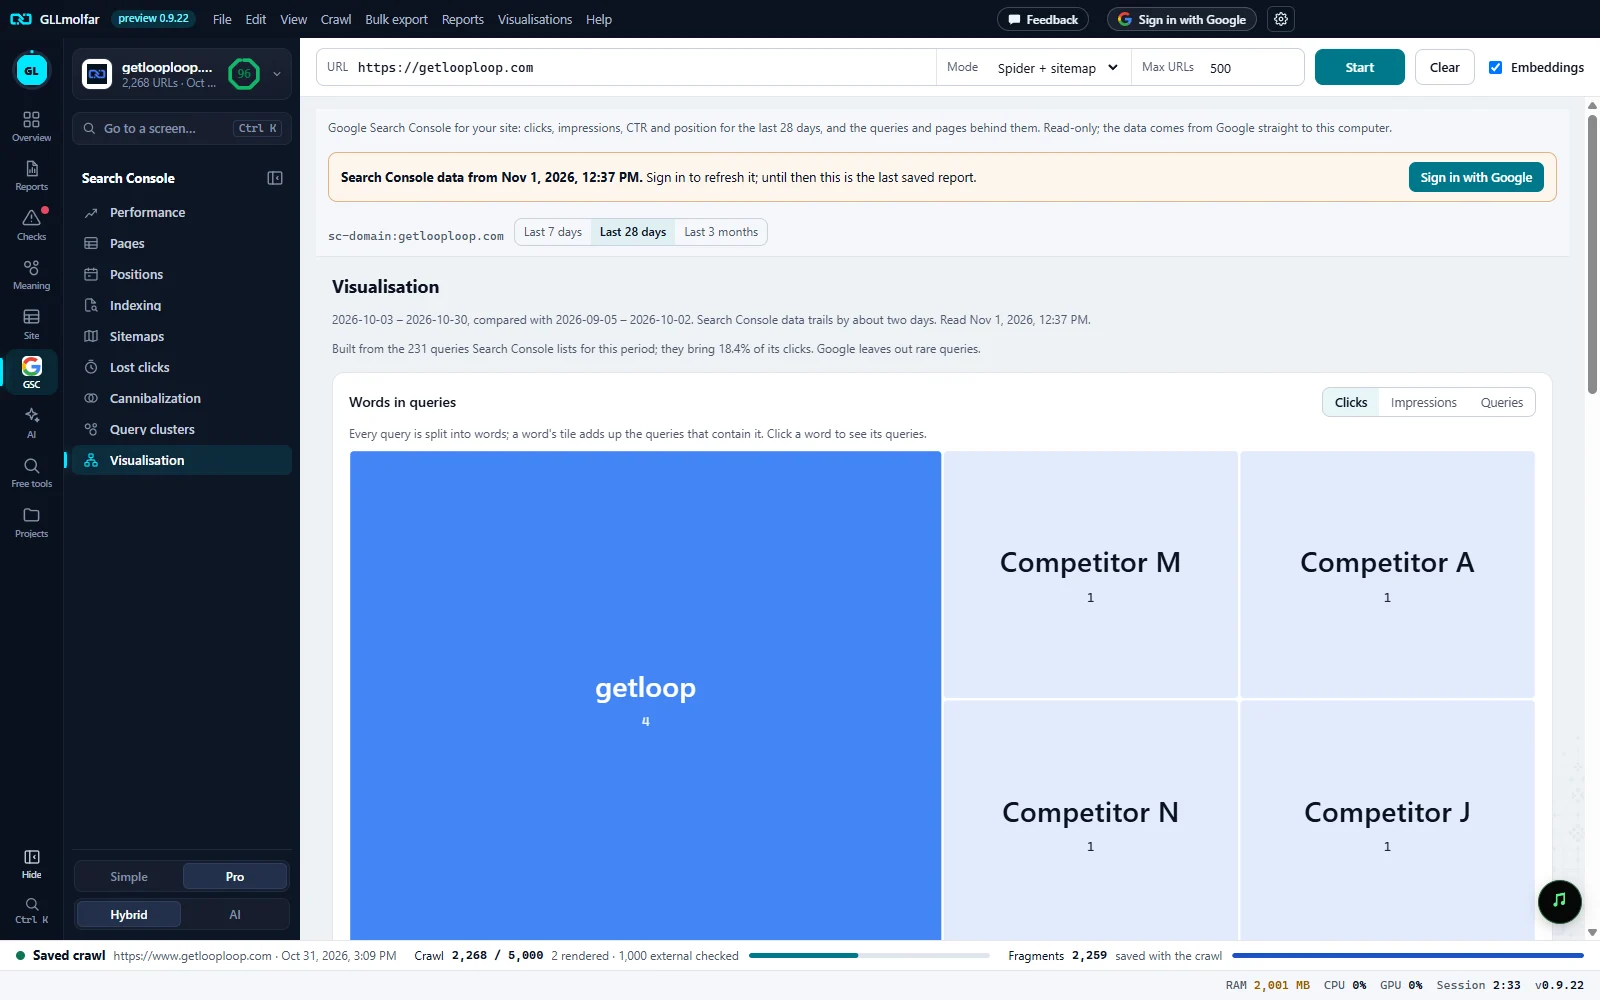
Period. The dates against the period before, and when the report was read.
Basis. How many queries Search Console lists for the period and their share of its clicks. Google leaves out rare queries.
Words in queries. Every query split into words; a word's tile adds up the queries that contain it.
Clicks, Impressions, Queries. What the tiles are sized and shaded by.
A word. Darker for more. Click it to see Queries with “{word}”.
Placeholder names. Competitor names in queries are replaced in this picture.
The charts
| Chart | What it shows |
|---|---|
| Words in queries | A treemap of the words in the queries, without words that carry no topic. Sized by clicks, impressions or the number of queries. |
| Queries by position | Queries in five bands, 1–3 to 51+. Number of queries, log scale. |
| Queries by CTR | Queries by click-through rate, 0–1% to 10%+. Number of queries, log scale. |
| Queries by impressions | Queries by impressions, 0–10 to 100K+. Number of queries, log scale. |
| Position against CTR | Each dot is a query, sized by impressions. The shaded band is positions 4–20, where one step up gains the most. Opportunities are drawn in their own colour; click a dot to open the query. |
| Opportunities | Queries on positions 4–20 with more impressions than most and a CTR below this site's own top-3 rate. Columns: query, position, CTR and + clicks, the clicks it would add at that rate. Up to 10. |
| How concentrated clicks are | Queries sorted by clicks; the line is the running share of all their clicks, the dashed diagonal an even spread. With the share of clicks from the top 10% of queries, and how many queries bring 80% of clicks. |
| Query length | Queries by the number of words in them; under each bar, its share of clicks. |
| Brand, questions and the rest | Clicks, impressions and queries split into Brand (the query contains the property's name), Questions (it starts with a question word, the way people ask an assistant) and Other. |
The same five position bands are listed in Positions. Questions people search are also gathered in AI.
States and messages
No queries in this period.
Nothing to draw.
Too few queries on positions 1–3 to know this site's top-3 CTR, so there is nothing to measure the others against.
In place of the opportunities.
No query fits: nothing on positions 4–20 with many impressions and a CTR below the top-3 rate.
In place of the opportunities.
No clicks in this period.
In place of the concentration chart.
The property's name is too short to tell brand queries apart. Questions: the query starts with a question word.
Brand is left out of the split.